

316
• Optimum nutrient level and adequate phytoplankton density (as nutrition of oyster is obtained through consumption of phytoplankton)
• Relative abundance of predators, like boring gastropod Cymatium, starfish, crabs
etc. (sites with high population and diversity of predators are always avoided as
they cause massive damage to oyster population)
• Availability and abundance of adult oyster stock in the vicinity of the culture site
(This is for ensuring oyster seed supply on regular basis)
There are two common methods for culturing oysters and these are:
(i) On-bottom culture
and
(ii) Off-bottom culture
In case of Indian Sundarbans, considering the background of siltation rate and
turbidity of the aquatic phase, off-bottom culture is most preferable and among various types of off-bottom culture most economic methods are:
(i) Rack and string culture
and
(ii) Rack and tray culture
Both these methods are very much suited in protected and deeper areas (>5 m)
having soft bottom particularly inside the mangrove – sheltered creeks. Brief
description of each of these methods is given here.
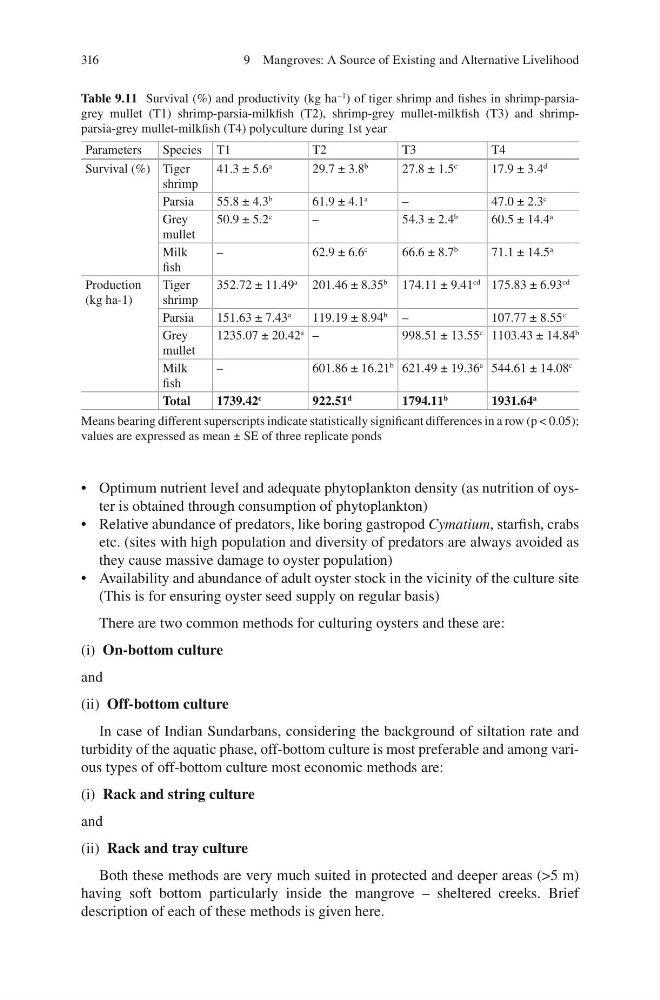
Table 9.11 Survival (%) and productivity (kg ha
−1 ) of tiger shrimp and fishes in shrimp-parsiagrey mullet (T1) shrimp-parsia-milkfish (T2), shrimp-grey mullet-milkfish (T3) and shrimpparsia- grey mullet-milkfish (T4) polyculture during 1st year
Parameters
Species T1
T2
T3
T4
Survival (%) Tiger
shrimp
41.3 ± 5.6
a
29.7 ± 3.8
b
27.8 ± 1.5
c
17.9 ± 3.4
d
Parsia
55.8 ± 4.3
b
61.9 ± 4.1
a
–
47.0 ± 2.3
c
Grey
mullet
50.9 ± 5.2
c
–
54.3 ± 2.4
b
60.5 ± 14.4
a
Milk
fish
–
62.9 ± 6.6
c
66.6 ± 8.7
b
71.1 ± 14.5
a
Production
(kg ha-1)
Tiger
shrimp
352.72 ± 11.49
a
201.46 ± 8.35
b
174.11 ± 9.41
cd 175.83 ± 6.93
cd
Parsia
151.63 ± 7.43
a
119.19 ± 8.94
b
–
107.77 ± 8.55
c
Grey
mullet
1235.07 ± 20.42
a –
998.51 ± 13.55
c 1103.43 ± 14.84
b
Milk
fish
–
601.86 ± 16.21
b 621.49 ± 19.36
a 544.61 ± 14.08
c
Total
1739.42
c
922.51
d
1794.11
b
1931.64
a
Means bearing different superscripts indicate statistically significant differences in a row (p < 0.05);
values are expressed as mean ± SE of three replicate ponds
9 Mangroves: A Source of Existing and Alternative Livelihood
• Optimum nutrient level and adequate phytoplankton density (as nutrition of oyster is obtained through consumption of phytoplankton)
• Relative abundance of predators, like boring gastropod Cymatium, starfish, crabs
etc. (sites with high population and diversity of predators are always avoided as
they cause massive damage to oyster population)
• Availability and abundance of adult oyster stock in the vicinity of the culture site
(This is for ensuring oyster seed supply on regular basis)
There are two common methods for culturing oysters and these are:
(i) On-bottom culture
and
(ii) Off-bottom culture
In case of Indian Sundarbans, considering the background of siltation rate and
turbidity of the aquatic phase, off-bottom culture is most preferable and among various types of off-bottom culture most economic methods are:
(i) Rack and string culture
and
(ii) Rack and tray culture
Both these methods are very much suited in protected and deeper areas (>5 m)
having soft bottom particularly inside the mangrove – sheltered creeks. Brief
description of each of these methods is given here.
Table 9.11 Survival (%) and productivity (kg ha
−1 ) of tiger shrimp and fishes in shrimp-parsiagrey mullet (T1) shrimp-parsia-milkfish (T2), shrimp-grey mullet-milkfish (T3) and shrimpparsia- grey mullet-milkfish (T4) polyculture during 1st year
Parameters
Species T1
T2
T3
T4
Survival (%) Tiger
shrimp
41.3 ± 5.6
a
29.7 ± 3.8
b
27.8 ± 1.5
c
17.9 ± 3.4
d
Parsia
55.8 ± 4.3
b
61.9 ± 4.1
a
–
47.0 ± 2.3
c
Grey
mullet
50.9 ± 5.2
c
–
54.3 ± 2.4
b
60.5 ± 14.4
a
Milk
fish
–
62.9 ± 6.6
c
66.6 ± 8.7
b
71.1 ± 14.5
a
Production
(kg ha-1)
Tiger
shrimp
352.72 ± 11.49
a
201.46 ± 8.35
b
174.11 ± 9.41
cd 175.83 ± 6.93
cd
Parsia
151.63 ± 7.43
a
119.19 ± 8.94
b
–
107.77 ± 8.55
c
Grey
mullet
1235.07 ± 20.42
a –
998.51 ± 13.55
c 1103.43 ± 14.84
b
Milk
fish
–
601.86 ± 16.21
b 621.49 ± 19.36
a 544.61 ± 14.08
c
Total
1739.42
c
922.51
d
1794.11
b
1931.64
a
Means bearing different superscripts indicate statistically significant differences in a row (p < 0.05);
values are expressed as mean ± SE of three replicate ponds
9 Mangroves: A Source of Existing and Alternative Livelihood