

314
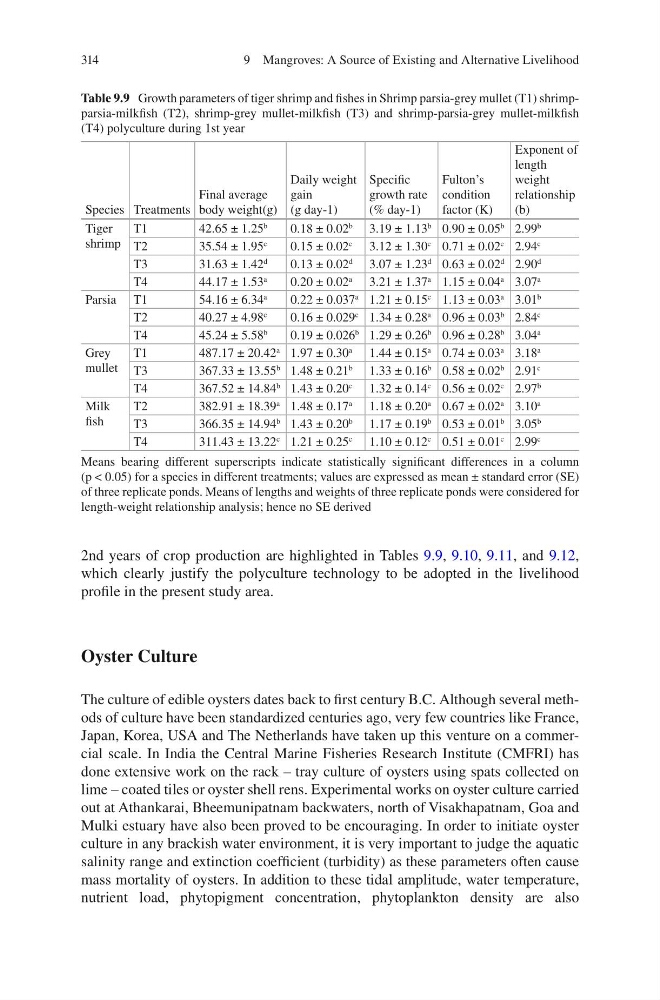
Table 9.9 Growth parameters of tiger shrimp and fishes in Shrimp parsia-grey mullet (T1) shrimpparsia-milkfish (T2), shrimp-grey mullet-milkfish (T3) and shrimp-parsia-grey mullet-milkfish
(T4) polyculture during 1st year
Species Treatments
Final average
body weight(g)
Daily weight
gain
(g day-1)
Specific
growth rate
(% day-1)
Fulton’s
condition
factor (K)
Exponent of
length
weight
relationship
(b)
Tiger
shrimp
T1
42.65 ± 1.25
b
0.18 ± 0.02
b
3.19 ± 1.13
b 0.90 ± 0.05
b 2.99
b
T2
35.54 ± 1.95
c
0.15 ± 0.02
c
3.12 ± 1.30
c 0.71 ± 0.02
c 2.94
c
T3
31.63 ± 1.42
d
0.13 ± 0.02
d
3.07 ± 1.23
d 0.63 ± 0.02
d 2.90
d
T4
44.17 ± 1.53
a
0.20 ± 0.02
a
3.21 ± 1.37
a 1.15 ± 0.04
a 3.07
a
Parsia T1
54.16 ± 6.34
a
0.22 ± 0.037
a 1.21 ± 0.15
c 1.13 ± 0.03
a 3.01
b
T2
40.27 ± 4.98
c
0.16 ± 0.029
c 1.34 ± 0.28
a 0.96 ± 0.03
b 2.84
c
T4
45.24 ± 5.58
b
0.19 ± 0.026
b 1.29 ± 0.26
b 0.96 ± 0.28
b 3.04
a
Grey
mullet
T1
487.17 ± 20.42
a 1.97 ± 0.30
a
1.44 ± 0.15
a 0.74 ± 0.03
a 3.18
a
T3
367.33 ± 13.55
b 1.48 ± 0.21
b
1.33 ± 0.16
b 0.58 ± 0.02
b 2.91
c
T4
367.52 ± 14.84
b 1.43 ± 0.20
c
1.32 ± 0.14
c 0.56 ± 0.02
c 2.97
b
Milk
fish
T2
382.91 ± 18.39
a 1.48 ± 0.17
a
1.18 ± 0.20
a 0.67 ± 0.02
a 3.10
a
T3
366.35 ± 14.94
b 1.43 ± 0.20
b
1.17 ± 0.19
b 0.53 ± 0.01
b 3.05
b
T4
311.43 ± 13.22
c 1.21 ± 0.25
c
1.10 ± 0.12
c 0.51 ± 0.01
c 2.99
c
Means bearing different superscripts indicate statistically significant differences in a column
(p < 0.05) for a species in different treatments; values are expressed as mean ± standard error (SE)
of three replicate ponds. Means of lengths and weights of three replicate ponds were considered for
length-weight relationship analysis; hence no SE derived
2nd years of crop production are highlighted in Tables 9.9, 9.10, 9.11, and 9.12,
which clearly justify the polyculture technology to be adopted in the livelihood
profile in the present study area.
Oyster Culture
The culture of edible oysters dates back to first century B.C. Although several methods of culture have been standardized centuries ago, very few countries like France,
Japan, Korea, USA and The Netherlands have taken up this venture on a commercial scale. In India the Central Marine Fisheries Research Institute (CMFRI) has
done extensive work on the rack – tray culture of oysters using spats collected on
lime – coated tiles or oyster shell rens. Experimental works on oyster culture carried
out at Athankarai, Bheemunipatnam backwaters, north of Visakhapatnam, Goa and
Mulki estuary have also been proved to be encouraging. In order to initiate oyster
culture in any brackish water environment, it is very important to judge the aquatic
salinity range and extinction coefficient (turbidity) as these parameters often cause
mass mortality of oysters. In addition to these tidal amplitude, water temperature,
nutrient load, phytopigment concentration, phytoplankton density are also
9 Mangroves: A Source of Existing and Alternative Livelihood
Table 9.9 Growth parameters of tiger shrimp and fishes in Shrimp parsia-grey mullet (T1) shrimpparsia-milkfish (T2), shrimp-grey mullet-milkfish (T3) and shrimp-parsia-grey mullet-milkfish
(T4) polyculture during 1st year
Species Treatments
Final average
body weight(g)
Daily weight
gain
(g day-1)
Specific
growth rate
(% day-1)
Fulton’s
condition
factor (K)
Exponent of
length
weight
relationship
(b)
Tiger
shrimp
T1
42.65 ± 1.25
b
0.18 ± 0.02
b
3.19 ± 1.13
b 0.90 ± 0.05
b 2.99
b
T2
35.54 ± 1.95
c
0.15 ± 0.02
c
3.12 ± 1.30
c 0.71 ± 0.02
c 2.94
c
T3
31.63 ± 1.42
d
0.13 ± 0.02
d
3.07 ± 1.23
d 0.63 ± 0.02
d 2.90
d
T4
44.17 ± 1.53
a
0.20 ± 0.02
a
3.21 ± 1.37
a 1.15 ± 0.04
a 3.07
a
Parsia T1
54.16 ± 6.34
a
0.22 ± 0.037
a 1.21 ± 0.15
c 1.13 ± 0.03
a 3.01
b
T2
40.27 ± 4.98
c
0.16 ± 0.029
c 1.34 ± 0.28
a 0.96 ± 0.03
b 2.84
c
T4
45.24 ± 5.58
b
0.19 ± 0.026
b 1.29 ± 0.26
b 0.96 ± 0.28
b 3.04
a
Grey
mullet
T1
487.17 ± 20.42
a 1.97 ± 0.30
a
1.44 ± 0.15
a 0.74 ± 0.03
a 3.18
a
T3
367.33 ± 13.55
b 1.48 ± 0.21
b
1.33 ± 0.16
b 0.58 ± 0.02
b 2.91
c
T4
367.52 ± 14.84
b 1.43 ± 0.20
c
1.32 ± 0.14
c 0.56 ± 0.02
c 2.97
b
Milk
fish
T2
382.91 ± 18.39
a 1.48 ± 0.17
a
1.18 ± 0.20
a 0.67 ± 0.02
a 3.10
a
T3
366.35 ± 14.94
b 1.43 ± 0.20
b
1.17 ± 0.19
b 0.53 ± 0.01
b 3.05
b
T4
311.43 ± 13.22
c 1.21 ± 0.25
c
1.10 ± 0.12
c 0.51 ± 0.01
c 2.99
c
Means bearing different superscripts indicate statistically significant differences in a column
(p < 0.05) for a species in different treatments; values are expressed as mean ± standard error (SE)
of three replicate ponds. Means of lengths and weights of three replicate ponds were considered for
length-weight relationship analysis; hence no SE derived
2nd years of crop production are highlighted in Tables 9.9, 9.10, 9.11, and 9.12,
which clearly justify the polyculture technology to be adopted in the livelihood
profile in the present study area.
Oyster Culture
The culture of edible oysters dates back to first century B.C. Although several methods of culture have been standardized centuries ago, very few countries like France,
Japan, Korea, USA and The Netherlands have taken up this venture on a commercial scale. In India the Central Marine Fisheries Research Institute (CMFRI) has
done extensive work on the rack – tray culture of oysters using spats collected on
lime – coated tiles or oyster shell rens. Experimental works on oyster culture carried
out at Athankarai, Bheemunipatnam backwaters, north of Visakhapatnam, Goa and
Mulki estuary have also been proved to be encouraging. In order to initiate oyster
culture in any brackish water environment, it is very important to judge the aquatic
salinity range and extinction coefficient (turbidity) as these parameters often cause
mass mortality of oysters. In addition to these tidal amplitude, water temperature,
nutrient load, phytopigment concentration, phytoplankton density are also
9 Mangroves: A Source of Existing and Alternative Livelihood