

164
Bengal below the Rajmahal hills rose in level and became suitable for human settlement. Later evidence suggests that the Bengal Basin tilted eastward during the
twelfth century because of neo-tectonic movement (Morgan and McIntire 1959).
The tectonic movements of the basin in different geological periods are one of the
important causes for the loss of landmass in some islands.
The frequent subsidence of some part of Sundarbans, causing the complete disappearance of forest chunk and settlement areas is the effect of “Swatch of no
ground” phenomenon. This zone also known as Ganga Trough is situated south
of the Raimangal – Malancha estuary between 21°00′ and 21°22′ latitude in the
Bay of Bengal region (Chaudhuri and Choudhury 1994) and has a comparatively
flat floor with walls of about 12° inclination. According to Oldham (1893), “there
is a singularly deep area in the sea outside the middle of the delta, which is marked
in the chart as Swatch of no ground. Here the soundings are from 5 to 10 fathoms
all round that change almost abruptly to 200 and even to 300 fathoms”. All the
estuaries in the Sundarbans delta (Hugli, Muriganga, Saptamukhi, Thakuran,
Matla, Bidyadhari, Gosaba and Harinbhanga) are believed to be influenced by
Swatch of no ground and the unstable condition of Sundarbans is due to the existence of this submarine zone (Chaudhuri and Choudhury 1994). These discussions
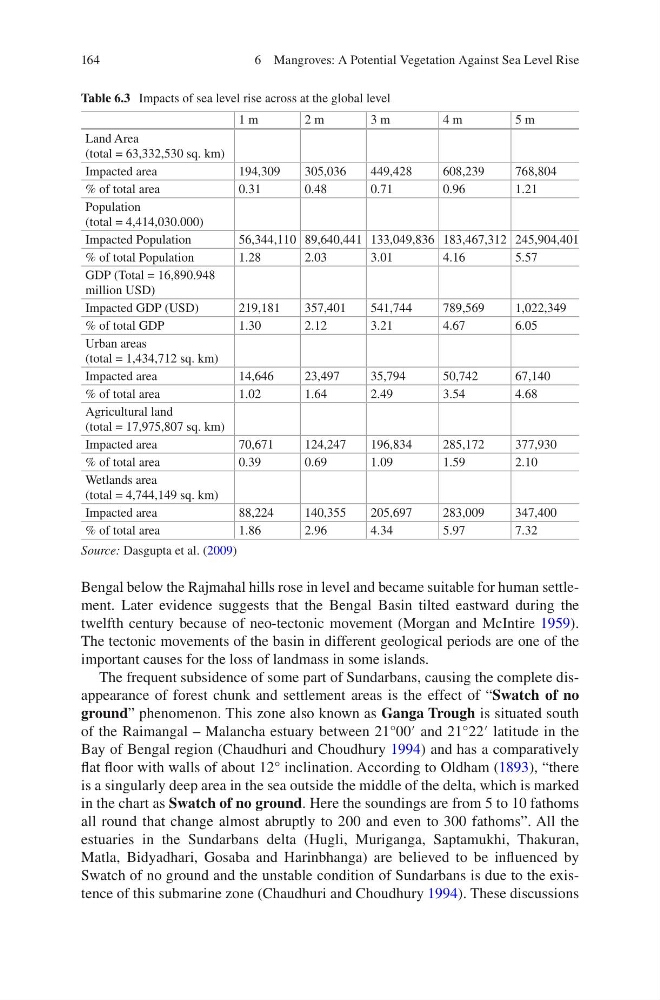
Table 6.3 Impacts of sea level rise across at the global level
1 m
2 m
3 m
4 m
5 m
Land Area
(total = 63,332,530 sq. km)
Impacted area
194,309
305,036
449,428
608,239
768,804
% of total area
0.31
0.48
0.71
0.96
1.21
Population
(total = 4,414,030.000)
Impacted Population
56,344,110 89,640,441 133,049,836 183,467,312 245,904,401
% of total Population
1.28
2.03
3.01
4.16
5.57
GDP (Total = 16,890.948
million USD)
Impacted GDP (USD)
219,181
357,401
541,744
789,569
1,022,349
% of total GDP
1.30
2.12
3.21
4.67
6.05
Urban areas
(total = 1,434,712 sq. km)
Impacted area
14,646
23,497
35,794
50,742
67,140
% of total area
1.02
1.64
2.49
3.54
4.68
Agricultural land
(total = 17,975,807 sq. km)
Impacted area
70,671
124,247
196,834
285,172
377,930
% of total area
0.39
0.69
1.09
1.59
2.10
Wetlands area
(total = 4,744,149 sq. km)
Impacted area
88,224
140,355
205,697
283,009
347,400
% of total area
1.86
2.96
4.34
5.97
7.32
Source: Dasgupta et al. (2009)
6 Mangroves: A Potential Vegetation Against Sea Level Rise
Bengal below the Rajmahal hills rose in level and became suitable for human settlement. Later evidence suggests that the Bengal Basin tilted eastward during the
twelfth century because of neo-tectonic movement (Morgan and McIntire 1959).
The tectonic movements of the basin in different geological periods are one of the
important causes for the loss of landmass in some islands.
The frequent subsidence of some part of Sundarbans, causing the complete disappearance of forest chunk and settlement areas is the effect of “Swatch of no
ground” phenomenon. This zone also known as Ganga Trough is situated south
of the Raimangal – Malancha estuary between 21°00′ and 21°22′ latitude in the
Bay of Bengal region (Chaudhuri and Choudhury 1994) and has a comparatively
flat floor with walls of about 12° inclination. According to Oldham (1893), “there
is a singularly deep area in the sea outside the middle of the delta, which is marked
in the chart as Swatch of no ground. Here the soundings are from 5 to 10 fathoms
all round that change almost abruptly to 200 and even to 300 fathoms”. All the
estuaries in the Sundarbans delta (Hugli, Muriganga, Saptamukhi, Thakuran,
Matla, Bidyadhari, Gosaba and Harinbhanga) are believed to be influenced by
Swatch of no ground and the unstable condition of Sundarbans is due to the existence of this submarine zone (Chaudhuri and Choudhury 1994). These discussions
Table 6.3 Impacts of sea level rise across at the global level
1 m
2 m
3 m
4 m
5 m
Land Area
(total = 63,332,530 sq. km)
Impacted area
194,309
305,036
449,428
608,239
768,804
% of total area
0.31
0.48
0.71
0.96
1.21
Population
(total = 4,414,030.000)
Impacted Population
56,344,110 89,640,441 133,049,836 183,467,312 245,904,401
% of total Population
1.28
2.03
3.01
4.16
5.57
GDP (Total = 16,890.948
million USD)
Impacted GDP (USD)
219,181
357,401
541,744
789,569
1,022,349
% of total GDP
1.30
2.12
3.21
4.67
6.05
Urban areas
(total = 1,434,712 sq. km)
Impacted area
14,646
23,497
35,794
50,742
67,140
% of total area
1.02
1.64
2.49
3.54
4.68
Agricultural land
(total = 17,975,807 sq. km)
Impacted area
70,671
124,247
196,834
285,172
377,930
% of total area
0.39
0.69
1.09
1.59
2.10
Wetlands area
(total = 4,744,149 sq. km)
Impacted area
88,224
140,355
205,697
283,009
347,400
% of total area
1.86
2.96
4.34
5.97
7.32
Source: Dasgupta et al. (2009)
6 Mangroves: A Potential Vegetation Against Sea Level Rise