

121
22.91 ± 2.18 ppb (at Bagmara) to 43.37 ± 2.43 ppb (at Kakdwip) in premonsoon; in
monsoon it ranged from 28.68 ± 2.38 ppb (at Bagmara) to 48.36 ± 3.11 ppb (at
Kakdwip) and in postmonsoon it ranged from 21.54 ± 2.14 ppb (at Bagmara) to
43.54 ± 2.99 ppb (at Kakdwip) in the year 2014. Dissolved Hg values were found to
range from 0.32 ± 0.01 ppb (at Bagmara) to 0.57 ± 0.01 ppb (at Kakdwip) in premonsoon; in monsoon it ranged from 0.34 ± 0.09 ppb (at Bagmara) to 0.65 ± 0.02 ppb
(at Kakdwip) and in postmonsoon it ranged from 0.33 ± 0.06 ppb (at Bagmara) to
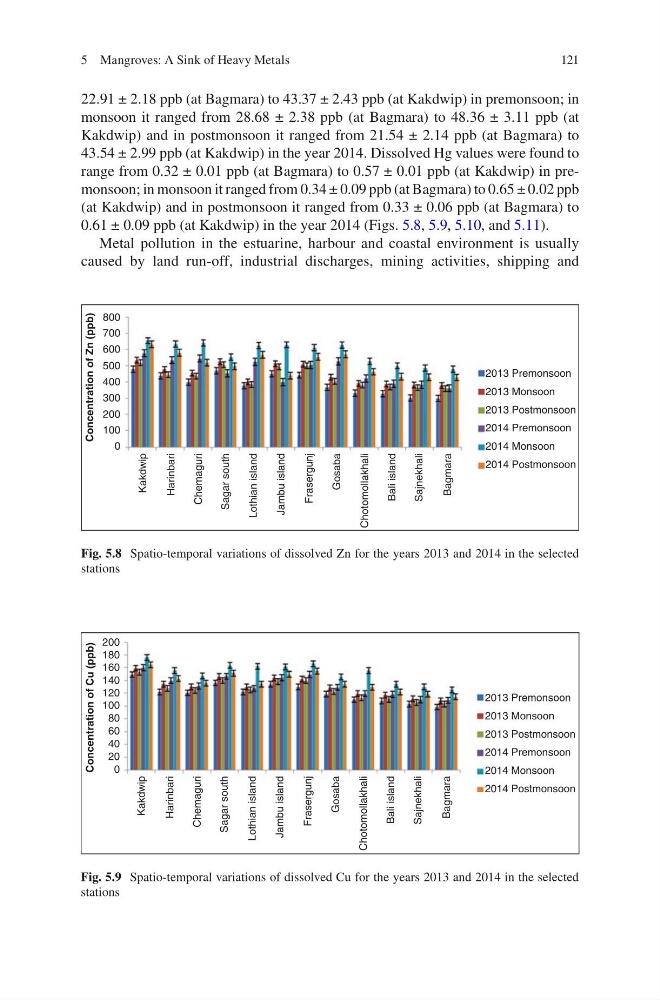
0.61 ± 0.09 ppb (at Kakdwip) in the year 2014 (Figs. 5.8, 5.9, 5.10, and 5.11).
Metal pollution in the estuarine, harbour and coastal environment is usually
caused by land run-off, industrial discharges, mining activities, shipping and
800
700
600
500
400
300
200
100
0
Kakdwip
Harinbari
Chemaguri
Sagar south
Lothian island
Jambu island
Frasergunj
Gosaba
Chotomollakhali
Bali island
Sajnekhali
Bagmara
2013 Premonsoon
2013 Postmonsoon
2013 Monsoon
2014 Premonsoon
2014 Postmonsoon
2014 Monsoon
Concentration of Zn (ppb)
Fig. 5.8 Spatio-temporal variations of dissolved Zn for the years 2013 and 2014 in the selected
stations
2013 Premonsoon
200
180
160
140
120
100
80
60
40
20
0
2013 Postmonsoon
2013 Monsoon
2014 Premonsoon
2014 Postmonsoon
2014 Monsoon
Kakdwip
Harinbari
Chemaguri
Sagar south
Lothian island
Jambu island
Frasergunj
Gosaba
Chotomollakhali
Bali island
Sajnekhali
Bagmara
Concentration of Cu (ppb)
Fig. 5.9 Spatio-temporal variations of dissolved Cu for the years 2013 and 2014 in the selected
stations
5 Mangroves: A Sink of Heavy Metals
22.91 ± 2.18 ppb (at Bagmara) to 43.37 ± 2.43 ppb (at Kakdwip) in premonsoon; in
monsoon it ranged from 28.68 ± 2.38 ppb (at Bagmara) to 48.36 ± 3.11 ppb (at
Kakdwip) and in postmonsoon it ranged from 21.54 ± 2.14 ppb (at Bagmara) to
43.54 ± 2.99 ppb (at Kakdwip) in the year 2014. Dissolved Hg values were found to
range from 0.32 ± 0.01 ppb (at Bagmara) to 0.57 ± 0.01 ppb (at Kakdwip) in premonsoon; in monsoon it ranged from 0.34 ± 0.09 ppb (at Bagmara) to 0.65 ± 0.02 ppb
(at Kakdwip) and in postmonsoon it ranged from 0.33 ± 0.06 ppb (at Bagmara) to
0.61 ± 0.09 ppb (at Kakdwip) in the year 2014 (Figs. 5.8, 5.9, 5.10, and 5.11).
Metal pollution in the estuarine, harbour and coastal environment is usually
caused by land run-off, industrial discharges, mining activities, shipping and
800
700
600
500
400
300
200
100
0
Kakdwip
Harinbari
Chemaguri
Sagar south
Lothian island
Jambu island
Frasergunj
Gosaba
Chotomollakhali
Bali island
Sajnekhali
Bagmara
2013 Premonsoon
2013 Postmonsoon
2013 Monsoon
2014 Premonsoon
2014 Postmonsoon
2014 Monsoon
Concentration of Zn (ppb)
Fig. 5.8 Spatio-temporal variations of dissolved Zn for the years 2013 and 2014 in the selected
stations
2013 Premonsoon
200
180
160
140
120
100
80
60
40
20
0
2013 Postmonsoon
2013 Monsoon
2014 Premonsoon
2014 Postmonsoon
2014 Monsoon
Kakdwip
Harinbari
Chemaguri
Sagar south
Lothian island
Jambu island
Frasergunj
Gosaba
Chotomollakhali
Bali island
Sajnekhali
Bagmara
Concentration of Cu (ppb)
Fig. 5.9 Spatio-temporal variations of dissolved Cu for the years 2013 and 2014 in the selected
stations
5 Mangroves: A Sink of Heavy Metals