

4.3 Carbon Black Dispersion as Revealed by 3D-TEM
75
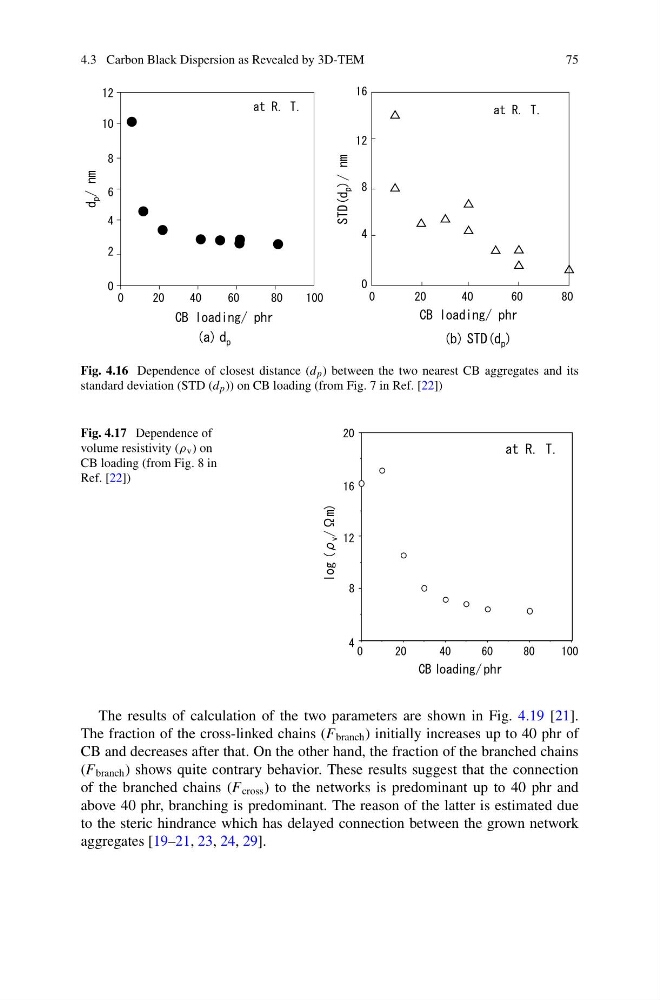
Fig. 4.16 Dependence of closest distance (d p ) between the two nearest CB aggregates and its
standard deviation (STD (d p )) on CB loading (from Fig. 7 in Ref. [22])
Fig. 4.17 Dependence of
volume resistivity (ρ v ) on
CB loading (from Fig. 8 in
Ref. [22])
The results of calculation of the two parameters are shown in Fig. 4.19 [21].
The fraction of the cross-linked chains (F branch ) initially increases up to 40 phr of
CB and decreases after that. On the other hand, the fraction of the branched chains
(F branch ) shows quite contrary behavior. These results suggest that the connection
of the branched chains (F cross ) to the networks is predominant up to 40 phr and
above 40 phr, branching is predominant. The reason of the latter is estimated due
to the steric hindrance which has delayed connection between the grown network
aggregates [19–21, 23, 24, 29].
75
Fig. 4.16 Dependence of closest distance (d p ) between the two nearest CB aggregates and its
standard deviation (STD (d p )) on CB loading (from Fig. 7 in Ref. [22])
Fig. 4.17 Dependence of
volume resistivity (ρ v ) on
CB loading (from Fig. 8 in
Ref. [22])
The results of calculation of the two parameters are shown in Fig. 4.19 [21].
The fraction of the cross-linked chains (F branch ) initially increases up to 40 phr of
CB and decreases after that. On the other hand, the fraction of the branched chains
(F branch ) shows quite contrary behavior. These results suggest that the connection
of the branched chains (F cross ) to the networks is predominant up to 40 phr and
above 40 phr, branching is predominant. The reason of the latter is estimated due
to the steric hindrance which has delayed connection between the grown network
aggregates [19–21, 23, 24, 29].