

5.4 Toward Nanofiller Networking in Rubber Matrix …
93
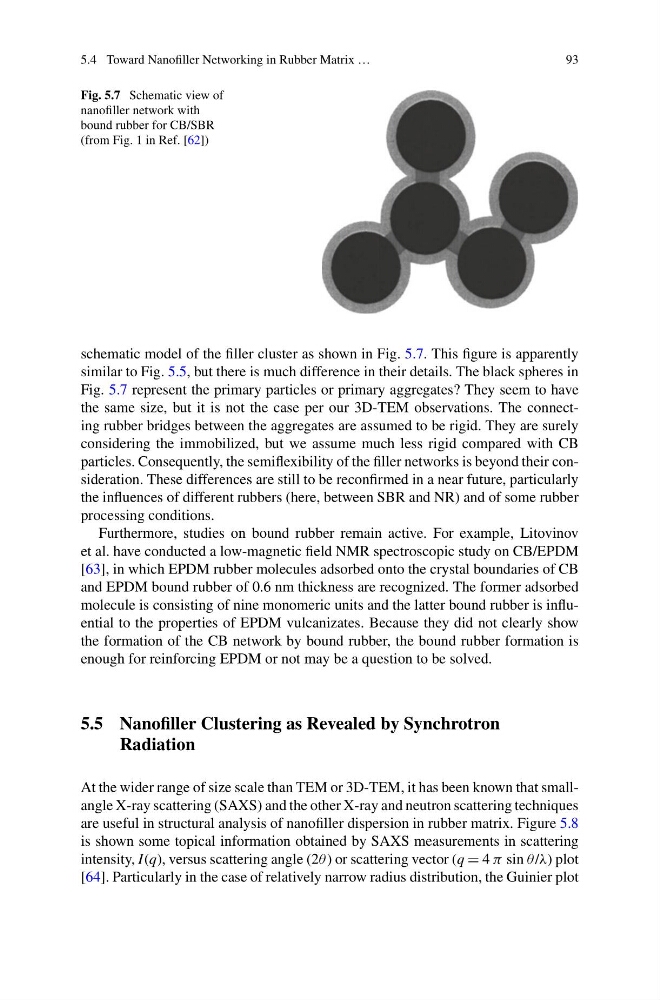
Fig. 5.7 Schematic view of
nanofiller network with
bound rubber for CB/SBR
(from Fig. 1 in Ref. [62])
schematic model of the filler cluster as shown in Fig. 5.7. This figure is apparently
similar to Fig. 5.5, but there is much difference in their details. The black spheres in
Fig. 5.7 represent the primary particles or primary aggregates? They seem to have
the same size, but it is not the case per our 3D-TEM observations. The connecting rubber bridges between the aggregates are assumed to be rigid. They are surely
considering the immobilized, but we assume much less rigid compared with CB
particles. Consequently, the semiflexibility of the filler networks is beyond their consideration. These differences are still to be reconfirmed in a near future, particularly
the influences of different rubbers (here, between SBR and NR) and of some rubber
processing conditions.
Furthermore, studies on bound rubber remain active. For example, Litovinov
et al. have conducted a low-magnetic field NMR spectroscopic study on CB/EPDM
[63], in which EPDM rubber molecules adsorbed onto the crystal boundaries of CB
and EPDM bound rubber of 0.6 nm thickness are recognized. The former adsorbed
molecule is consisting of nine monomeric units and the latter bound rubber is influential to the properties of EPDM vulcanizates. Because they did not clearly show
the formation of the CB network by bound rubber, the bound rubber formation is
enough for reinforcing EPDM or not may be a question to be solved.
5.5 Nanofiller Clustering as Revealed by Synchrotron
Radiation
At the wider range of size scale than TEM or 3D-TEM, it has been known that smallangle X-ray scattering (SAXS) and the other X-ray and neutron scattering techniques
are useful in structural analysis of nanofiller dispersion in rubber matrix. Figure 5.8
is shown some topical information obtained by SAXS measurements in scattering
intensity, I(q), versus scattering angle (2θ ) or scattering vector (q = 4 π sin θ /λ) plot
[64]. Particularly in the case of relatively narrow radius distribution, the Guinier plot
93
Fig. 5.7 Schematic view of
nanofiller network with
bound rubber for CB/SBR
(from Fig. 1 in Ref. [62])
schematic model of the filler cluster as shown in Fig. 5.7. This figure is apparently
similar to Fig. 5.5, but there is much difference in their details. The black spheres in
Fig. 5.7 represent the primary particles or primary aggregates? They seem to have
the same size, but it is not the case per our 3D-TEM observations. The connecting rubber bridges between the aggregates are assumed to be rigid. They are surely
considering the immobilized, but we assume much less rigid compared with CB
particles. Consequently, the semiflexibility of the filler networks is beyond their consideration. These differences are still to be reconfirmed in a near future, particularly
the influences of different rubbers (here, between SBR and NR) and of some rubber
processing conditions.
Furthermore, studies on bound rubber remain active. For example, Litovinov
et al. have conducted a low-magnetic field NMR spectroscopic study on CB/EPDM
[63], in which EPDM rubber molecules adsorbed onto the crystal boundaries of CB
and EPDM bound rubber of 0.6 nm thickness are recognized. The former adsorbed
molecule is consisting of nine monomeric units and the latter bound rubber is influential to the properties of EPDM vulcanizates. Because they did not clearly show
the formation of the CB network by bound rubber, the bound rubber formation is
enough for reinforcing EPDM or not may be a question to be solved.
5.5 Nanofiller Clustering as Revealed by Synchrotron
Radiation
At the wider range of size scale than TEM or 3D-TEM, it has been known that smallangle X-ray scattering (SAXS) and the other X-ray and neutron scattering techniques
are useful in structural analysis of nanofiller dispersion in rubber matrix. Figure 5.8
is shown some topical information obtained by SAXS measurements in scattering
intensity, I(q), versus scattering angle (2θ ) or scattering vector (q = 4 π sin θ /λ) plot
[64]. Particularly in the case of relatively narrow radius distribution, the Guinier plot