

100
80
60
40
Weight (%)
20
0
0
200
400
Temperature (°C)
600
C25A
C25A in EHBT (wt%)
6
4
2
0 (pure EHBT)
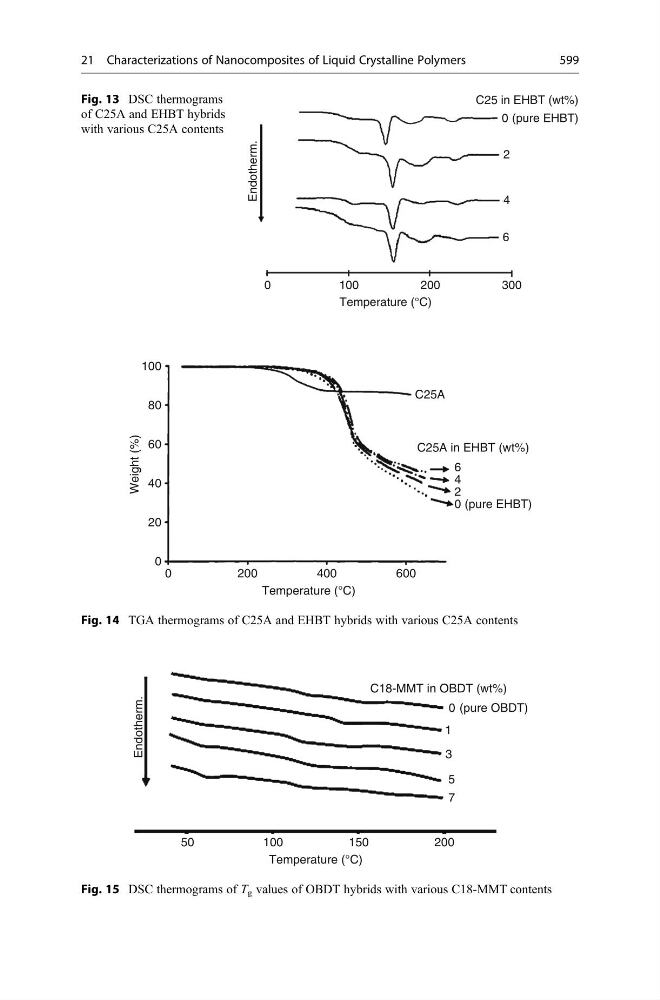
Fig. 14 TGA thermograms of C25A and EHBT hybrids with various C25A contents
50
Endotherm.
100
150
Temperature (°C)
200
1
3
5
7
0
C18-MMT in OBDT (wt%)
(pure OBDT)
Fig. 15 DSC thermograms of T g values of OBDT hybrids with various C18-MMT contents
Endotherm.
Temperature (°C)
0
100
200
300
0 (pure EHBT)
C25 in EHBT (wt%)
2
4
6
Fig. 13 DSC thermograms
of C25A and EHBT hybrids
with various C25A contents
21 Characterizations of Nanocomposites of Liquid Crystalline Polymers
599