

(Table 2). The maximum transition peaks of the OBDT hybrids increase with the
addition of clay up to a critical content and then decrease above that critical loading.
For example, the T m and T i values of the 1 wt% C18-MMT/OBDT hybrid are 289 and
324
C, respectively. When the organoclay content in OBDT reaches 5 wt%, T m is
282
C, and T i is 309
C (see Fig. 16).
These decreases seem to be the result of clay agglomeration, which occurs upon
the addition of clay to the polymer matrix above a critical clay loading. Agglomeration also reduces the heat insulation effect of the clay layers in the polymer matrix.
However, agglomerated structures form and become denser in the TLCP matrix
above a critical clay content (1 wt%). The presence of organoclay agglomeration in
TLCP was confirmed using the XRD and electron microscopy results (see Figs. 4, 8,
9, and 10).
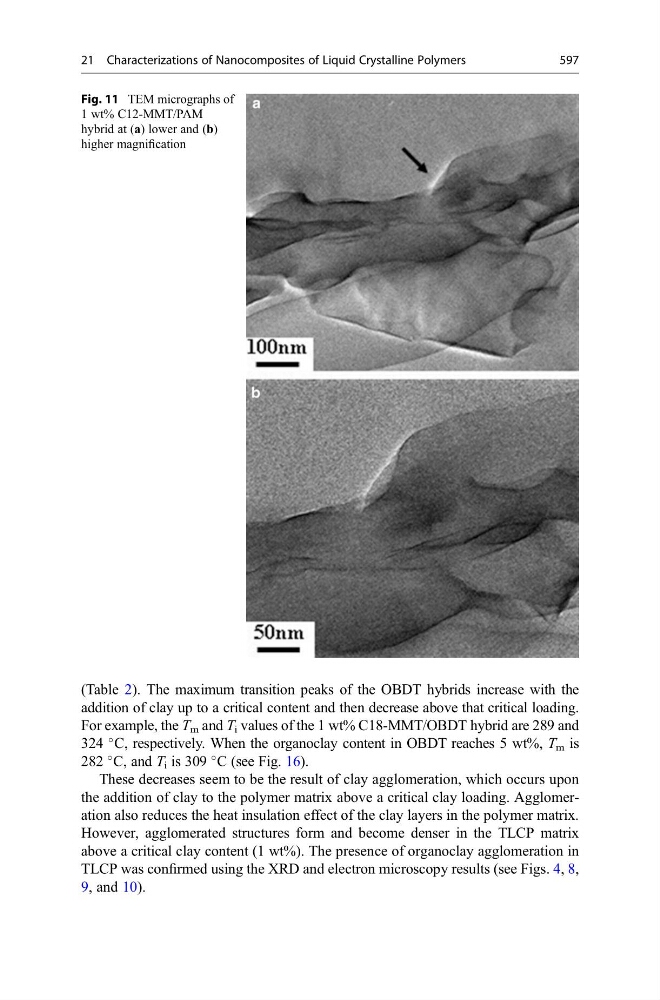
Fig. 11 TEM micrographs of
1 wt% C12-MMT/PAM
hybrid at (a) lower and (b)
higher magnification
21 Characterizations of Nanocomposites of Liquid Crystalline Polymers
597