

larger than this value. It was the electron-microscopic analyses that provided evidence for the formation of nanoscale hybrids.
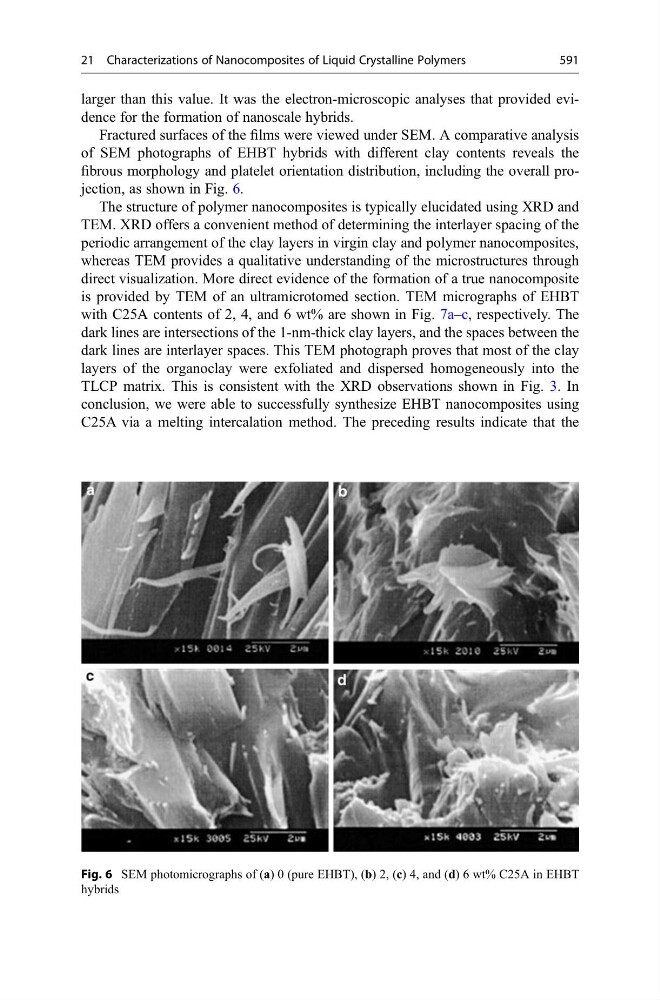
Fractured surfaces of the films were viewed under SEM. A comparative analysis
of SEM photographs of EHBT hybrids with different clay contents reveals the
fibrous morphology and platelet orientation distribution, including the overall projection, as shown in Fig. 6.
The structure of polymer nanocomposites is typically elucidated using XRD and
TEM. XRD offers a convenient method of determining the interlayer spacing of the
periodic arrangement of the clay layers in virgin clay and polymer nanocomposites,
whereas TEM provides a qualitative understanding of the microstructures through
direct visualization. More direct evidence of the formation of a true nanocomposite
is provided by TEM of an ultramicrotomed section. TEM micrographs of EHBT
with C25A contents of 2, 4, and 6 wt% are shown in Fig. 7a–c, respectively. The
dark lines are intersections of the 1-nm-thick clay layers, and the spaces between the
dark lines are interlayer spaces. This TEM photograph proves that most of the clay
layers of the organoclay were exfoliated and dispersed homogeneously into the
TLCP matrix. This is consistent with the XRD observations shown in Fig. 3. In
conclusion, we were able to successfully synthesize EHBT nanocomposites using
C25A via a melting intercalation method. The preceding results indicate that the
Fig. 6 SEM photomicrographs of (a) 0 (pure EHBT), (b) 2, (c) 4, and (d) 6 wt% C25A in EHBT
hybrids
21 Characterizations of Nanocomposites of Liquid Crystalline Polymers
591