

Statistical Literature Data Analysis in Crystalline and Liquid
Crystalline Polymers
Statistical analyses were performed based on approximately 300 different polymers
(250 crystalline and 50 liquid crystalline). This study employed the published gas
transport properties determined at 25–35
C with 1–10 atm of feed pressure for
crystalline and those determined at 20–40
C and 1–10 atm for liquid crystalline
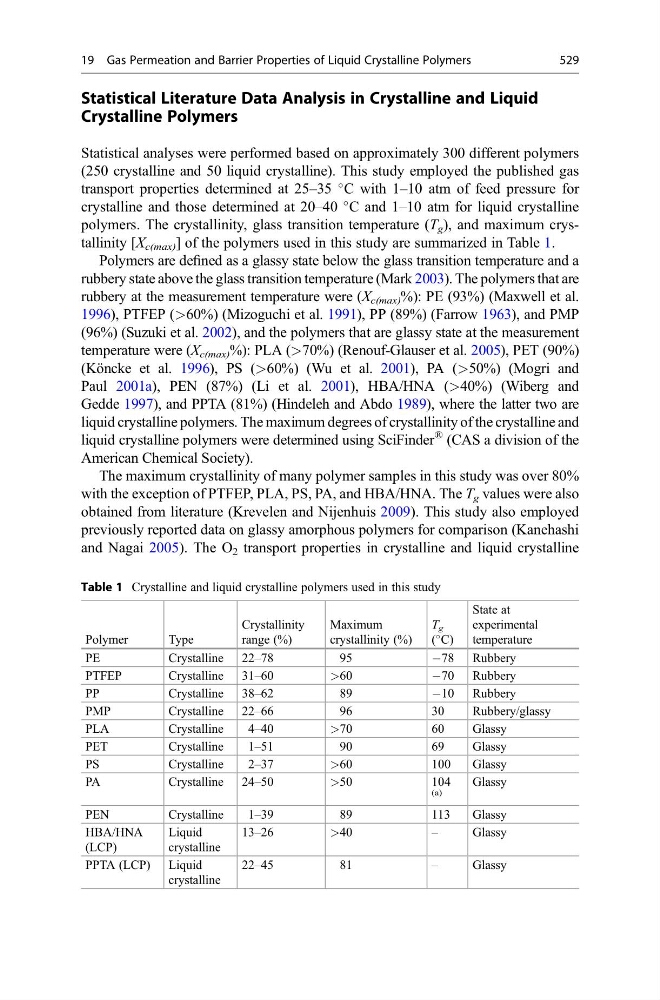
polymers. The crystallinity, glass transition temperature (T g ), and maximum crystallinity [X c(max) ] of the polymers used in this study are summarized in Table 1.
Polymers are defined as a glassy state below the glass transition temperature and a
rubbery state above the glass transition temperature (Mark 2003). The polymers that are
rubbery at the measurement temperature were (X c(max) %): PE (93%) (Maxwell et al.
1996), PTFEP (>60%) (Mizoguchi et al. 1991), PP (89%) (Farrow 1963), and PMP
(96%) (Suzuki et al. 2002), and the polymers that are glassy state at the measurement
temperature were (X c(max) %): PLA (>70%) (Renouf-Glauser et al. 2005), PET (90%)
(Köncke et al. 1996), PS (>60%) (Wu et al. 2001), PA (>50%) (Mogri and
Paul 2001a), PEN (87%) (Li et al. 2001), HBA/HNA (>40%) (Wiberg and
Gedde 1997), and PPTA (81%) (Hindeleh and Abdo 1989), where the latter two are
liquid crystalline polymers. The maximum degrees of crystallinity of the crystalline and
liquid crystalline polymers were determined using SciFinder
® (CAS a division of the
American Chemical Society).
The maximum crystallinity of many polymer samples in this study was over 80%
with the exception of PTFEP, PLA, PS, PA, and HBA/HNA. The T g values were also
obtained from literature (Krevelen and Nijenhuis 2009). This study also employed
previously reported data on glassy amorphous polymers for comparison (Kanehashi
and Nagai 2005). The O 2 transport properties in crystalline and liquid crystalline
Table 1 Crystalline and liquid crystalline polymers used in this study
Polymer
Type
Crystallinity
range (%)
Maximum
crystallinity (%)
T g
(
C)
State at
experimental
temperature
PE
Crystalline 22–78
95
À78 Rubbery
PTFEP
Crystalline 31–60
>60
À70 Rubbery
PP
Crystalline 38–62
89
À10 Rubbery
PMP
Crystalline 22–66
96
30
Rubbery/glassy
PLA
Crystalline
4–40
>70
60
Glassy
PET
Crystalline
1–51
90
69
Glassy
PS
Crystalline
2–37
>60
100
Glassy
PA
Crystalline 24–50
>50
104
(a)
Glassy
PEN
Crystalline
1–39
89
113
Glassy
HBA/HNA
(LCP)
Liquid
crystalline
13–26
>40
–
Glassy
PPTA (LCP) Liquid
crystalline
22–45
81
–
Glassy
19 Gas Permeation and Barrier Properties of Liquid Crystalline Polymers
529
Crystalline Polymers
Statistical analyses were performed based on approximately 300 different polymers
(250 crystalline and 50 liquid crystalline). This study employed the published gas
transport properties determined at 25–35
C with 1–10 atm of feed pressure for
crystalline and those determined at 20–40
C and 1–10 atm for liquid crystalline
polymers. The crystallinity, glass transition temperature (T g ), and maximum crystallinity [X c(max) ] of the polymers used in this study are summarized in Table 1.
Polymers are defined as a glassy state below the glass transition temperature and a
rubbery state above the glass transition temperature (Mark 2003). The polymers that are
rubbery at the measurement temperature were (X c(max) %): PE (93%) (Maxwell et al.
1996), PTFEP (>60%) (Mizoguchi et al. 1991), PP (89%) (Farrow 1963), and PMP
(96%) (Suzuki et al. 2002), and the polymers that are glassy state at the measurement
temperature were (X c(max) %): PLA (>70%) (Renouf-Glauser et al. 2005), PET (90%)
(Köncke et al. 1996), PS (>60%) (Wu et al. 2001), PA (>50%) (Mogri and
Paul 2001a), PEN (87%) (Li et al. 2001), HBA/HNA (>40%) (Wiberg and
Gedde 1997), and PPTA (81%) (Hindeleh and Abdo 1989), where the latter two are
liquid crystalline polymers. The maximum degrees of crystallinity of the crystalline and
liquid crystalline polymers were determined using SciFinder
® (CAS a division of the
American Chemical Society).
The maximum crystallinity of many polymer samples in this study was over 80%
with the exception of PTFEP, PLA, PS, PA, and HBA/HNA. The T g values were also
obtained from literature (Krevelen and Nijenhuis 2009). This study also employed
previously reported data on glassy amorphous polymers for comparison (Kanehashi
and Nagai 2005). The O 2 transport properties in crystalline and liquid crystalline
Table 1 Crystalline and liquid crystalline polymers used in this study
Polymer
Type
Crystallinity
range (%)
Maximum
crystallinity (%)
T g
(
C)
State at
experimental
temperature
PE
Crystalline 22–78
95
À78 Rubbery
PTFEP
Crystalline 31–60
>60
À70 Rubbery
PP
Crystalline 38–62
89
À10 Rubbery
PMP
Crystalline 22–66
96
30
Rubbery/glassy
PLA
Crystalline
4–40
>70
60
Glassy
PET
Crystalline
1–51
90
69
Glassy
PS
Crystalline
2–37
>60
100
Glassy
PA
Crystalline 24–50
>50
104
(a)
Glassy
PEN
Crystalline
1–39
89
113
Glassy
HBA/HNA
(LCP)
Liquid
crystalline
13–26
>40
–
Glassy
PPTA (LCP) Liquid
crystalline
22–45
81
–
Glassy
19 Gas Permeation and Barrier Properties of Liquid Crystalline Polymers
529