

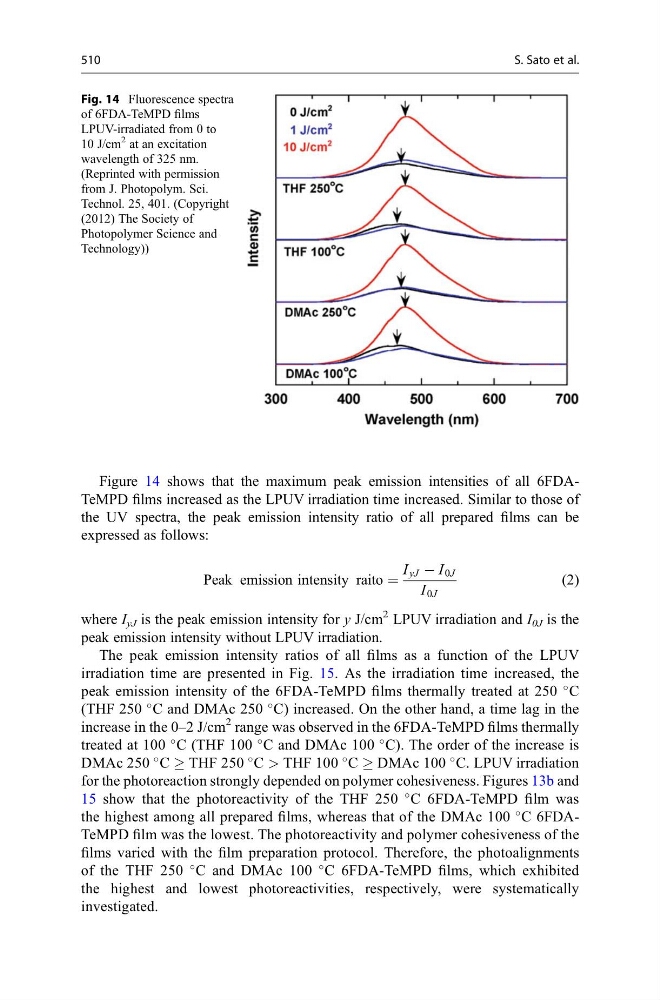
Figure 14 shows that the maximum peak emission intensities of all 6FDATeMPD films increased as the LPUV irradiation time increased. Similar to those of
the UV spectra, the peak emission intensity ratio of all prepared films can be
expressed as follows:
Peak emission intensity raito ¼
I yJ À I 0J
I 0J
(2)
where I yJ is the peak emission intensity for y J/cm
2 LPUV irradiation and I 0J is the
peak emission intensity without LPUV irradiation.
The peak emission intensity ratios of all films as a function of the LPUV
irradiation time are presented in Fig. 15. As the irradiation time increased, the
peak emission intensity of the 6FDA-TeMPD films thermally treated at 250
C
(THF 250
C and DMAc 250
C) increased. On the other hand, a time lag in the
increase in the 0–2 J/cm
2 range was observed in the 6FDA-TeMPD films thermally
treated at 100
C (THF 100
C and DMAc 100
C). The order of the increase is
DMAc 250
C ! THF 250
C > THF 100
C ! DMAc 100
C. LPUV irradiation
for the photoreaction strongly depended on polymer cohesiveness. Figures 13b and
15 show that the photoreactivity of the THF 250
C 6FDA-TeMPD film was
the highest among all prepared films, whereas that of the DMAc 100
C 6FDATeMPD film was the lowest. The photoreactivity and polymer cohesiveness of the
films varied with the film preparation protocol. Therefore, the photoalignments
of the THF 250
C and DMAc 100
C 6FDA-TeMPD films, which exhibited
the highest and lowest photoreactivities, respectively, were systematically
investigated.
Fig. 14 Fluorescence spectra
of 6FDA-TeMPD films
LPUV-irradiated from 0 to
10 J/cm
2 at an excitation
wavelength of 325 nm.
(Reprinted with permission
from J. Photopolym. Sci.
Technol. 25, 401. (Copyright
(2012) The Society of
Photopolymer Science and
Technology))
510
S. Sato et al.
the UV spectra, the peak emission intensity ratio of all prepared films can be
expressed as follows:
Peak emission intensity raito ¼
I yJ À I 0J
I 0J
(2)
where I yJ is the peak emission intensity for y J/cm
2 LPUV irradiation and I 0J is the
peak emission intensity without LPUV irradiation.
The peak emission intensity ratios of all films as a function of the LPUV
irradiation time are presented in Fig. 15. As the irradiation time increased, the
peak emission intensity of the 6FDA-TeMPD films thermally treated at 250
C
(THF 250
C and DMAc 250
C) increased. On the other hand, a time lag in the
increase in the 0–2 J/cm
2 range was observed in the 6FDA-TeMPD films thermally
treated at 100
C (THF 100
C and DMAc 100
C). The order of the increase is
DMAc 250
C ! THF 250
C > THF 100
C ! DMAc 100
C. LPUV irradiation
for the photoreaction strongly depended on polymer cohesiveness. Figures 13b and
15 show that the photoreactivity of the THF 250
C 6FDA-TeMPD film was
the highest among all prepared films, whereas that of the DMAc 100
C 6FDATeMPD film was the lowest. The photoreactivity and polymer cohesiveness of the
films varied with the film preparation protocol. Therefore, the photoalignments
of the THF 250
C and DMAc 100
C 6FDA-TeMPD films, which exhibited
the highest and lowest photoreactivities, respectively, were systematically
investigated.
Fig. 14 Fluorescence spectra
of 6FDA-TeMPD films
LPUV-irradiated from 0 to
10 J/cm
2 at an excitation
wavelength of 325 nm.
(Reprinted with permission
from J. Photopolym. Sci.
Technol. 25, 401. (Copyright
(2012) The Society of
Photopolymer Science and
Technology))
510
S. Sato et al.