

absorption spectra was observed because the calculated absorption spectra were for
one unit of their polymers. However, the existence of two peaks in the calculated
absorption region was in good agreement with that in the observed absorption in the
current study. Two significant peaks were observed from 5.6 to 5.8 eV (No. 1) and at
6.5 eV (No. 2) in the calculated 6FDA-based polyimides; the peak at 4.9 eV was
absorbed. The No. 1 peak positions were 5.69 eV for 6FDA-mPD, 5.66 eV for
6FDA-MPD, 5.67 eV for 6FDA-TMPD, and 5.70 eV for 6FDA-TeMPD. These peak
positions were almost constant. However, the calculated peak position was higher
than the observed position. In contrast, the No. 2 peak position did not change. The
calculated peak position was higher than the observed position, similar to the
No. 1 peak. Therefore, in 6FDA-TeMPD, these two peaks (i.e., Nos. 1 and 2) changed
by LPUV irradiation were assigned based on the result of the MO calculation.
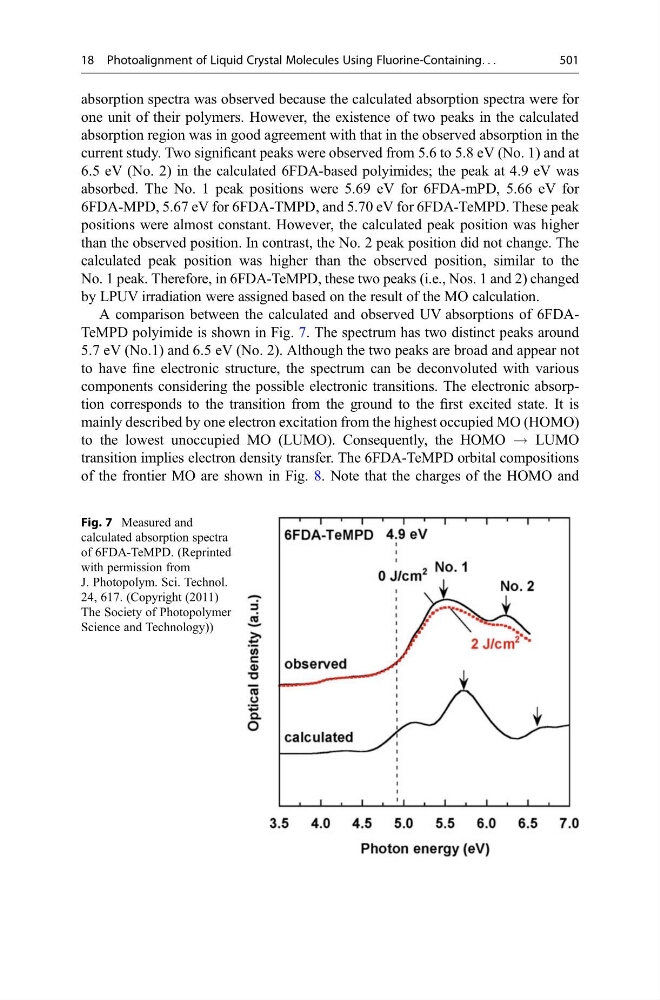
A comparison between the calculated and observed UV absorptions of 6FDATeMPD polyimide is shown in Fig. 7. The spectrum has two distinct peaks around
5.7 eV (No.1) and 6.5 eV (No. 2). Although the two peaks are broad and appear not
to have fine electronic structure, the spectrum can be deconvoluted with various
components considering the possible electronic transitions. The electronic absorption corresponds to the transition from the ground to the first excited state. It is
mainly described by one electron excitation from the highest occupied MO (HOMO)
to the lowest unoccupied MO (LUMO). Consequently, the HOMO ! LUMO
transition implies electron density transfer. The 6FDA-TeMPD orbital compositions
of the frontier MO are shown in Fig. 8. Note that the charges of the HOMO and
Fig. 7 Measured and
calculated absorption spectra
of 6FDA-TeMPD. (Reprinted
with permission from
J. Photopolym. Sci. Technol.
24, 617. (Copyright (2011)
The Society of Photopolymer
Science and Technology))
18 Photoalignment of Liquid Crystal Molecules Using Fluorine-Containing. . .
501
one unit of their polymers. However, the existence of two peaks in the calculated
absorption region was in good agreement with that in the observed absorption in the
current study. Two significant peaks were observed from 5.6 to 5.8 eV (No. 1) and at
6.5 eV (No. 2) in the calculated 6FDA-based polyimides; the peak at 4.9 eV was
absorbed. The No. 1 peak positions were 5.69 eV for 6FDA-mPD, 5.66 eV for
6FDA-MPD, 5.67 eV for 6FDA-TMPD, and 5.70 eV for 6FDA-TeMPD. These peak
positions were almost constant. However, the calculated peak position was higher
than the observed position. In contrast, the No. 2 peak position did not change. The
calculated peak position was higher than the observed position, similar to the
No. 1 peak. Therefore, in 6FDA-TeMPD, these two peaks (i.e., Nos. 1 and 2) changed
by LPUV irradiation were assigned based on the result of the MO calculation.
A comparison between the calculated and observed UV absorptions of 6FDATeMPD polyimide is shown in Fig. 7. The spectrum has two distinct peaks around
5.7 eV (No.1) and 6.5 eV (No. 2). Although the two peaks are broad and appear not
to have fine electronic structure, the spectrum can be deconvoluted with various
components considering the possible electronic transitions. The electronic absorption corresponds to the transition from the ground to the first excited state. It is
mainly described by one electron excitation from the highest occupied MO (HOMO)
to the lowest unoccupied MO (LUMO). Consequently, the HOMO ! LUMO
transition implies electron density transfer. The 6FDA-TeMPD orbital compositions
of the frontier MO are shown in Fig. 8. Note that the charges of the HOMO and
Fig. 7 Measured and
calculated absorption spectra
of 6FDA-TeMPD. (Reprinted
with permission from
J. Photopolym. Sci. Technol.
24, 617. (Copyright (2011)
The Society of Photopolymer
Science and Technology))
18 Photoalignment of Liquid Crystal Molecules Using Fluorine-Containing. . .
501