

Microstructural Analysis of LCBBC73–25 k
Figure 5 represents small-angle X-ray scattering (SAXS) diffractograms of LCBBCs
where two types of scattering reflections are noted, including (i) microphase segregation (qà and its higher-order reflections) and (2) LC order (qLC).
Microphase segregation: SAXS curve suggests microphase segregation (qÃ) with
higher-order peaks and is indicated by blue arrows as shown in Fig. 6. Primary peak
and its higher-order reflections appearing at ratio qÃ, √3 qÃ, and √4 qà implies that
the system forms hexagonally packed PEG cylinders in the LC major matrix of
cyanobiphenyl domains. The d-spacing is d BCP = 15.31 nm, while inter-cylinder
distance is d CYL = 17.7 nm (d CYL = (4/3)
1/2
Ãd BCP ).
Fig. 5 also shows LC scattering peak at q LC = 1.17 nm
À1 corresponding to a
smectic layer period of d LC = 5.42 nm. According to the thermal analysis, the system
Table 1 Molecular characterization of LCBBC73–25 k
Polymer
Mol (%) of LC
Mol. Wt. (Kg/mol)
a
Mol %
b
LCBBC73–25 k
27
Theor.
GPC (PDI)
NBCB12
NBMPEG
26
32 (1.10)
74.3 (73)
25.7 (27)
a Determined by GPC with ELSD detector, where THF was used as eluent and polystyrene standards
were used to construct a conventional calibration
b
Mol % of each monomer is calculated from the NMR spectrum of the polymer, where peaks at
3.330 and 6.930 are used to quantify composition of NBMPEG and NBCB12, respectively. Values
in parentheses indicate concentration of monomer in feed
100
80
60
Weight (%)
Temperature (°C)
40
20
0
50
150
250
350
450
550
650
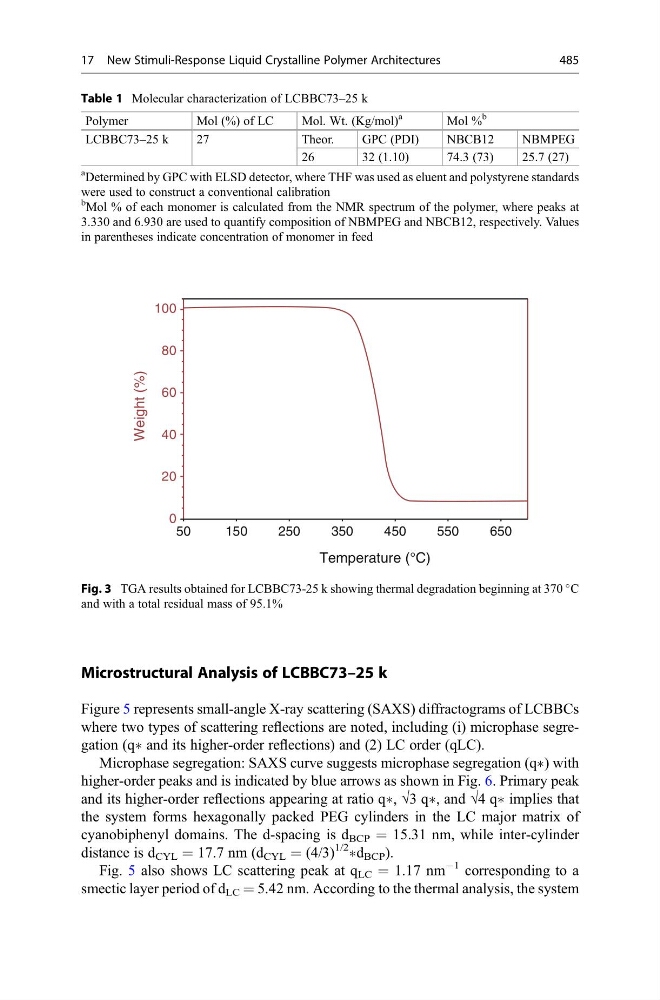
Fig. 3 TGA results obtained for LCBBC73-25 k showing thermal degradation beginning at 370
C
and with a total residual mass of 95.1%
17 New Stimuli-Response Liquid Crystalline Polymer Architectures
485
Figure 5 represents small-angle X-ray scattering (SAXS) diffractograms of LCBBCs
where two types of scattering reflections are noted, including (i) microphase segregation (qà and its higher-order reflections) and (2) LC order (qLC).
Microphase segregation: SAXS curve suggests microphase segregation (qÃ) with
higher-order peaks and is indicated by blue arrows as shown in Fig. 6. Primary peak
and its higher-order reflections appearing at ratio qÃ, √3 qÃ, and √4 qà implies that
the system forms hexagonally packed PEG cylinders in the LC major matrix of
cyanobiphenyl domains. The d-spacing is d BCP = 15.31 nm, while inter-cylinder
distance is d CYL = 17.7 nm (d CYL = (4/3)
1/2
Ãd BCP ).
Fig. 5 also shows LC scattering peak at q LC = 1.17 nm
À1 corresponding to a
smectic layer period of d LC = 5.42 nm. According to the thermal analysis, the system
Table 1 Molecular characterization of LCBBC73–25 k
Polymer
Mol (%) of LC
Mol. Wt. (Kg/mol)
a
Mol %
b
LCBBC73–25 k
27
Theor.
GPC (PDI)
NBCB12
NBMPEG
26
32 (1.10)
74.3 (73)
25.7 (27)
a Determined by GPC with ELSD detector, where THF was used as eluent and polystyrene standards
were used to construct a conventional calibration
b
Mol % of each monomer is calculated from the NMR spectrum of the polymer, where peaks at
3.330 and 6.930 are used to quantify composition of NBMPEG and NBCB12, respectively. Values
in parentheses indicate concentration of monomer in feed
100
80
60
Weight (%)
Temperature (°C)
40
20
0
50
150
250
350
450
550
650
Fig. 3 TGA results obtained for LCBBC73-25 k showing thermal degradation beginning at 370
C
and with a total residual mass of 95.1%
17 New Stimuli-Response Liquid Crystalline Polymer Architectures
485