

Shear-Induced Textural Transitions in Shear Flow-Aligning
Thermotropic LCPs
In this section, we show the rheological behavior in start-up of simple shear flow of a
representative flow-aligning rigid rod-like thermotropic liquid crystal polymer,
carried out with the LdG model (Tsuji and Rey 1997, 1998, 2000; Rey and Denn
2002). The specific issue in this section is to elucidate the relation between rheological properties (shear stress) and textural transformations for flow-aligning thermotropic polymeric nematic liquid crystals (NLCs).
The dynamic nematics (DNS) approach uses governing equations that describes
defect nucleation, defect cores, and defect-defect interaction and is in principle able
to capture flow-induced textural transformations. Details of the defect processes
discussed in this section are presented in Grecov and Rey (2003a-c, 2004, 2006).
Figure 9a, b shows the computed gray scale visualizations of the director component
n z (0 y
Ã
1) as a function of strain.
Darker regions represent in-plane orientation (n z = 0) and lighter regions represent orientation along the vorticity axis (n z = 1); for (a) Er = 10
3 (De = 0.002) in the
symmetric mode and (b) Er = 6 Â 10
4 (De = 0.12) in the defect lattice mode, with
three inversion walls. Figure 9c shows the transient evolution of the dimensionless
shear stress as function of strain for Er = 10
3 (De = 0.002), corresponding to Fig. 9a,
for the symmetric mode. Figure 9d shows the transient evolution of the dimensionless shear stress as function of strain for Er = 6 Â 10
4 (De = 0.12), corresponding to
Fig. 9b, for the defect lattice mode. The shear stress evolution shows three regions
0
–10.0
–6.0
–2.0
Shear stress(dyne/cm 2
)–ξ
2.0
6.0
8
1 6
2 4
ξ=0
ξ=0
ξ=1
ξ=2
ξ=3
ξ=4
ξ=5
Time(sec)
32
40
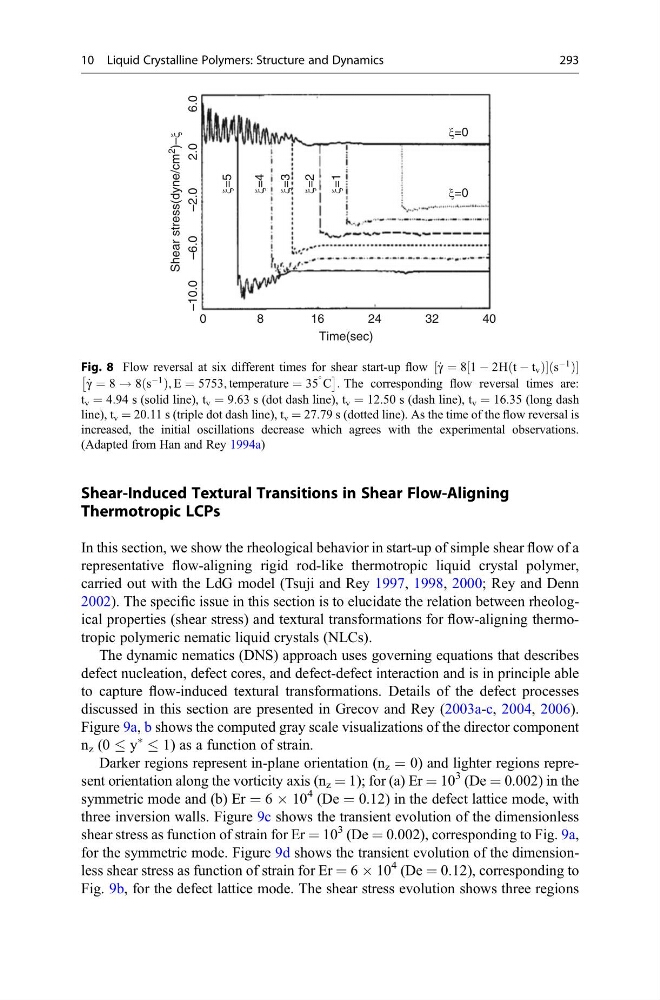
Fig. 8 Flow reversal at six different times for shear start-up flow _
γ ¼ 8 1 À 2Η t À t v
ð
Þ
½
s
À1
ð Þ
½
_
γ ¼ 8 ! 8 s
À1
ð Þ, Ε ¼ 5753, temperature ¼ 35
C
Â
à : The corresponding flow reversal times are:
t v = 4.94 s (solid line), t v = 9.63 s (dot dash line), t v = 12.50 s (dash line), t v = 16.35 (long dash
line), t v = 20.11 s (triple dot dash line), t v = 27.79 s (dotted line). As the time of the flow reversal is
increased, the initial oscillations decrease which agrees with the experimental observations.
(Adapted from Han and Rey 1994a)
10 Liquid Crystalline Polymers: Structure and Dynamics
293
Thermotropic LCPs
In this section, we show the rheological behavior in start-up of simple shear flow of a
representative flow-aligning rigid rod-like thermotropic liquid crystal polymer,
carried out with the LdG model (Tsuji and Rey 1997, 1998, 2000; Rey and Denn
2002). The specific issue in this section is to elucidate the relation between rheological properties (shear stress) and textural transformations for flow-aligning thermotropic polymeric nematic liquid crystals (NLCs).
The dynamic nematics (DNS) approach uses governing equations that describes
defect nucleation, defect cores, and defect-defect interaction and is in principle able
to capture flow-induced textural transformations. Details of the defect processes
discussed in this section are presented in Grecov and Rey (2003a-c, 2004, 2006).
Figure 9a, b shows the computed gray scale visualizations of the director component
n z (0 y
Ã
1) as a function of strain.
Darker regions represent in-plane orientation (n z = 0) and lighter regions represent orientation along the vorticity axis (n z = 1); for (a) Er = 10
3 (De = 0.002) in the
symmetric mode and (b) Er = 6 Â 10
4 (De = 0.12) in the defect lattice mode, with
three inversion walls. Figure 9c shows the transient evolution of the dimensionless
shear stress as function of strain for Er = 10
3 (De = 0.002), corresponding to Fig. 9a,
for the symmetric mode. Figure 9d shows the transient evolution of the dimensionless shear stress as function of strain for Er = 6 Â 10
4 (De = 0.12), corresponding to
Fig. 9b, for the defect lattice mode. The shear stress evolution shows three regions
0
–10.0
–6.0
–2.0
Shear stress(dyne/cm 2
)–ξ
2.0
6.0
8
1 6
2 4
ξ=0
ξ=0
ξ=1
ξ=2
ξ=3
ξ=4
ξ=5
Time(sec)
32
40
Fig. 8 Flow reversal at six different times for shear start-up flow _
γ ¼ 8 1 À 2Η t À t v
ð
Þ
½
s
À1
ð Þ
½
_
γ ¼ 8 ! 8 s
À1
ð Þ, Ε ¼ 5753, temperature ¼ 35
C
Â
à : The corresponding flow reversal times are:
t v = 4.94 s (solid line), t v = 9.63 s (dot dash line), t v = 12.50 s (dash line), t v = 16.35 (long dash
line), t v = 20.11 s (triple dot dash line), t v = 27.79 s (dotted line). As the time of the flow reversal is
increased, the initial oscillations decrease which agrees with the experimental observations.
(Adapted from Han and Rey 1994a)
10 Liquid Crystalline Polymers: Structure and Dynamics
293