

Topics in Current Chemistry (2020) 378:3
1 3
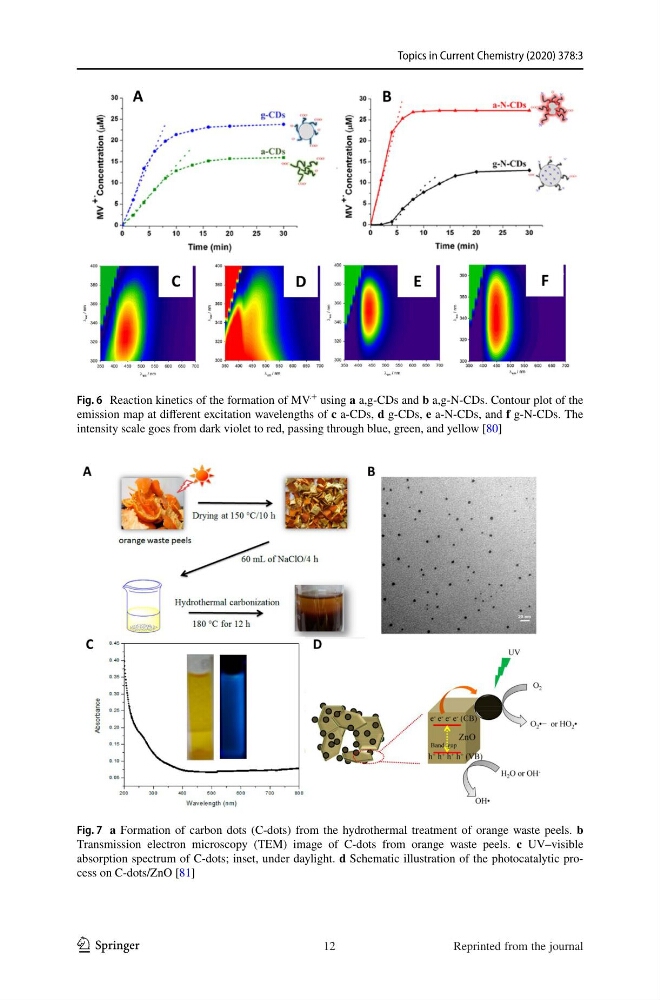
Fig. 6 Reaction kinetics of the formation of MV
.+ using a a,g-CDs and b a,g-N-CDs. Contour plot of the
emission map at different excitation wavelengths of c a-CDs, d g-CDs, e a-N-CDs, and f g-N-CDs. The
intensity scale goes from dark violet to red, passing through blue, green, and yellow [80]
Fig. 7 a Formation of carbon dots (C-dots) from the hydrothermal treatment of orange waste peels. b
Transmission electron microscopy (TEM) image of C-dots from orange waste peels. c UV–visible
absorption spectrum of C-dots; inset, under daylight. d Schematic illustration of the photocatalytic process on C-dots/ZnO [81]
12
Reprinted from the journal
1 3
Fig. 6 Reaction kinetics of the formation of MV
.+ using a a,g-CDs and b a,g-N-CDs. Contour plot of the
emission map at different excitation wavelengths of c a-CDs, d g-CDs, e a-N-CDs, and f g-N-CDs. The
intensity scale goes from dark violet to red, passing through blue, green, and yellow [80]
Fig. 7 a Formation of carbon dots (C-dots) from the hydrothermal treatment of orange waste peels. b
Transmission electron microscopy (TEM) image of C-dots from orange waste peels. c UV–visible
absorption spectrum of C-dots; inset, under daylight. d Schematic illustration of the photocatalytic process on C-dots/ZnO [81]
12
Reprinted from the journal