

1 3
Topics in Current Chemistry (2019) 377:24
properties of the uranium species [52]. The same technique was used to follow
the evolution of Bi nanoparticles supported in titania nanotubes. Initially, a surface passivation of the Bi nanoparticles is detected by XPS under air. As shown
in Fig. 9, after excitation of the Bi nanoparticles surface plasmon by visible light
absorption, a charge transfer process takes place, reducing the bismuth oxide
overlayer located at the surface of the particles. The process does not take place
in the absence of titania, which acts as a bridge in the electron handling, likely
due to the existence of long-lived trap states at the titania semiconductor. This
favors charge separation and photo-activity [53]. Earlier XPS experiments tested
the C/Ti ratio in titania materials to show that light excitation effectively triggers
the decomposition of dyes [54].
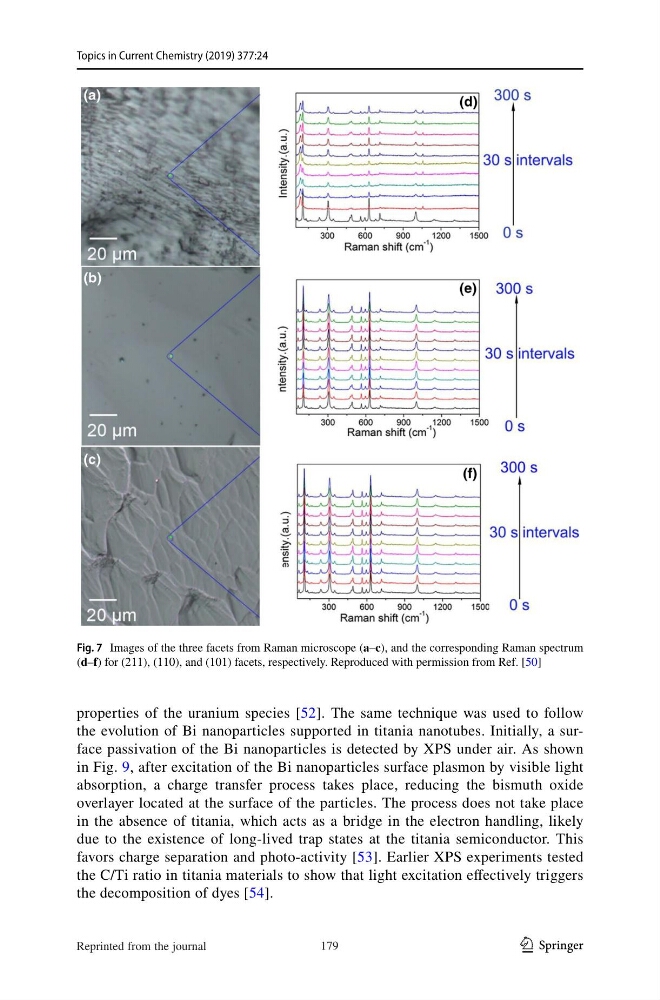
Fig. 7 Images of the three facets from Raman microscope (a–c), and the corresponding Raman spectrum
(d–f) for (211), (110), and (101) facets, respectively. Reproduced with permission from Ref. [50]
179
Reprinted from the journal
Topics in Current Chemistry (2019) 377:24
properties of the uranium species [52]. The same technique was used to follow
the evolution of Bi nanoparticles supported in titania nanotubes. Initially, a surface passivation of the Bi nanoparticles is detected by XPS under air. As shown
in Fig. 9, after excitation of the Bi nanoparticles surface plasmon by visible light
absorption, a charge transfer process takes place, reducing the bismuth oxide
overlayer located at the surface of the particles. The process does not take place
in the absence of titania, which acts as a bridge in the electron handling, likely
due to the existence of long-lived trap states at the titania semiconductor. This
favors charge separation and photo-activity [53]. Earlier XPS experiments tested
the C/Ti ratio in titania materials to show that light excitation effectively triggers
the decomposition of dyes [54].
Fig. 7 Images of the three facets from Raman microscope (a–c), and the corresponding Raman spectrum
(d–f) for (211), (110), and (101) facets, respectively. Reproduced with permission from Ref. [50]
179
Reprinted from the journal