

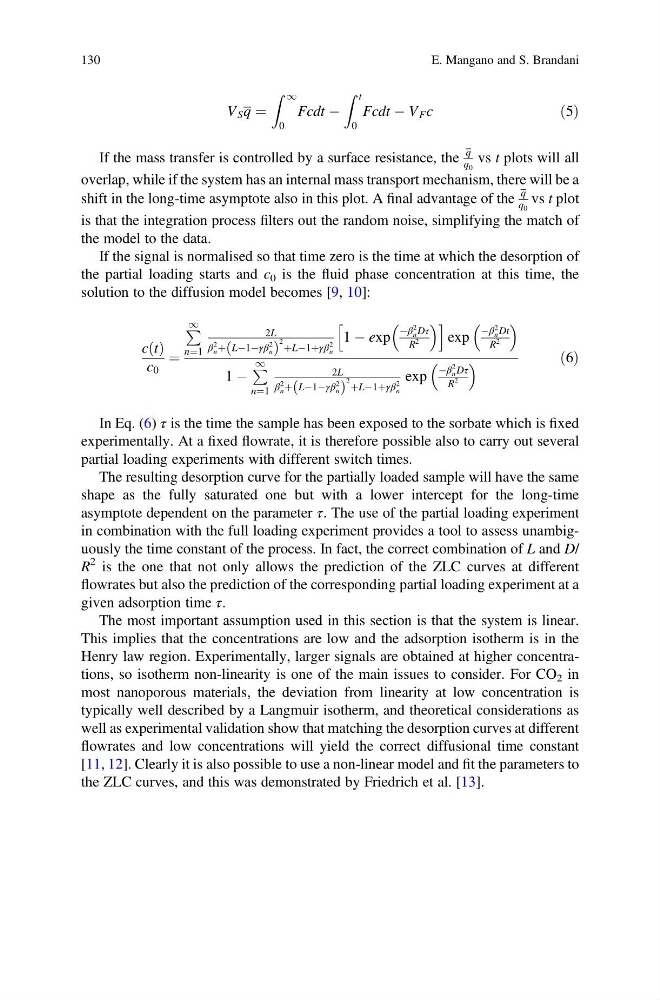
V S q ¼
Z 1
0
Fcdt À
Z t
0
Fcdt À V F c
ð5Þ
If the mass transfer is controlled by a surface resistance, the
q
q 0
vs t plots will all
overlap, while if the system has an internal mass transport mechanism, there will be a
shift in the long-time asymptote also in this plot. A final advantage of the
q
q 0
vs t plot
is that the integration process filters out the random noise, simplifying the match of
the model to the data.
If the signal is normalised so that time zero is the time at which the desorption of
the partial loading starts and c 0 is the fluid phase concentration at this time, the
solution to the diffusion model becomes [9, 10]:
c t
ð Þ
c 0
¼
P 1
n¼1
2L
β
2
n þ LÀ1Àγβ
2
n
ð
Þ
2 þLÀ1þγβ
2
n
1 À exp
Àβ
2
n Dτ
R
2
h
i
exp
Àβ
2
n Dt
R
2
1 À
P 1
n¼1
2L
β
2
n þ LÀ1Àγβ
2
n
ð
Þ
2 þLÀ1þγβ
2
n
exp
Àβ
2
n Dτ
R
2
ð6Þ
In Eq. (6) τ is the time the sample has been exposed to the sorbate which is fixed
experimentally. At a fixed flowrate, it is therefore possible also to carry out several
partial loading experiments with different switch times.
The resulting desorption curve for the partially loaded sample will have the same
shape as the fully saturated one but with a lower intercept for the long-time
asymptote dependent on the parameter τ. The use of the partial loading experiment
in combination with the full loading experiment provides a tool to assess unambiguously the time constant of the process. In fact, the correct combination of L and D/
R
2 is the one that not only allows the prediction of the ZLC curves at different
flowrates but also the prediction of the corresponding partial loading experiment at a
given adsorption time τ.
The most important assumption used in this section is that the system is linear.
This implies that the concentrations are low and the adsorption isotherm is in the
Henry law region. Experimentally, larger signals are obtained at higher concentrations, so isotherm non-linearity is one of the main issues to consider. For CO 2 in
most nanoporous materials, the deviation from linearity at low concentration is
typically well described by a Langmuir isotherm, and theoretical considerations as
well as experimental validation show that matching the desorption curves at different
flowrates and low concentrations will yield the correct diffusional time constant
[11, 12]. Clearly it is also possible to use a non-linear model and fit the parameters to
the ZLC curves, and this was demonstrated by Friedrich et al. [13].
130
E. Mangano and S. Brandani
Z 1
0
Fcdt À
Z t
0
Fcdt À V F c
ð5Þ
If the mass transfer is controlled by a surface resistance, the
q
q 0
vs t plots will all
overlap, while if the system has an internal mass transport mechanism, there will be a
shift in the long-time asymptote also in this plot. A final advantage of the
q
q 0
vs t plot
is that the integration process filters out the random noise, simplifying the match of
the model to the data.
If the signal is normalised so that time zero is the time at which the desorption of
the partial loading starts and c 0 is the fluid phase concentration at this time, the
solution to the diffusion model becomes [9, 10]:
c t
ð Þ
c 0
¼
P 1
n¼1
2L
β
2
n þ LÀ1Àγβ
2
n
ð
Þ
2 þLÀ1þγβ
2
n
1 À exp
Àβ
2
n Dτ
R
2
h
i
exp
Àβ
2
n Dt
R
2
1 À
P 1
n¼1
2L
β
2
n þ LÀ1Àγβ
2
n
ð
Þ
2 þLÀ1þγβ
2
n
exp
Àβ
2
n Dτ
R
2
ð6Þ
In Eq. (6) τ is the time the sample has been exposed to the sorbate which is fixed
experimentally. At a fixed flowrate, it is therefore possible also to carry out several
partial loading experiments with different switch times.
The resulting desorption curve for the partially loaded sample will have the same
shape as the fully saturated one but with a lower intercept for the long-time
asymptote dependent on the parameter τ. The use of the partial loading experiment
in combination with the full loading experiment provides a tool to assess unambiguously the time constant of the process. In fact, the correct combination of L and D/
R
2 is the one that not only allows the prediction of the ZLC curves at different
flowrates but also the prediction of the corresponding partial loading experiment at a
given adsorption time τ.
The most important assumption used in this section is that the system is linear.
This implies that the concentrations are low and the adsorption isotherm is in the
Henry law region. Experimentally, larger signals are obtained at higher concentrations, so isotherm non-linearity is one of the main issues to consider. For CO 2 in
most nanoporous materials, the deviation from linearity at low concentration is
typically well described by a Langmuir isotherm, and theoretical considerations as
well as experimental validation show that matching the desorption curves at different
flowrates and low concentrations will yield the correct diffusional time constant
[11, 12]. Clearly it is also possible to use a non-linear model and fit the parameters to
the ZLC curves, and this was demonstrated by Friedrich et al. [13].
130
E. Mangano and S. Brandani