

adsorption at low pressure, characteristics of microporous materials, followed by the
formation of the mono-multilayer, and, finally, at higher relative pressures, the gas
adsorption due to the presence of mesopores. The inset of Fig. 6 shows the semilogarithmic plot of the isotherm, where the original relative pressure range to apply
the BET method is marked with black diamonds and the corresponding range using
IUPAC criteria by red triangles. In this figure, we can see that these relative pressure
ranges differ significantly; therefore the S BET value will be different.
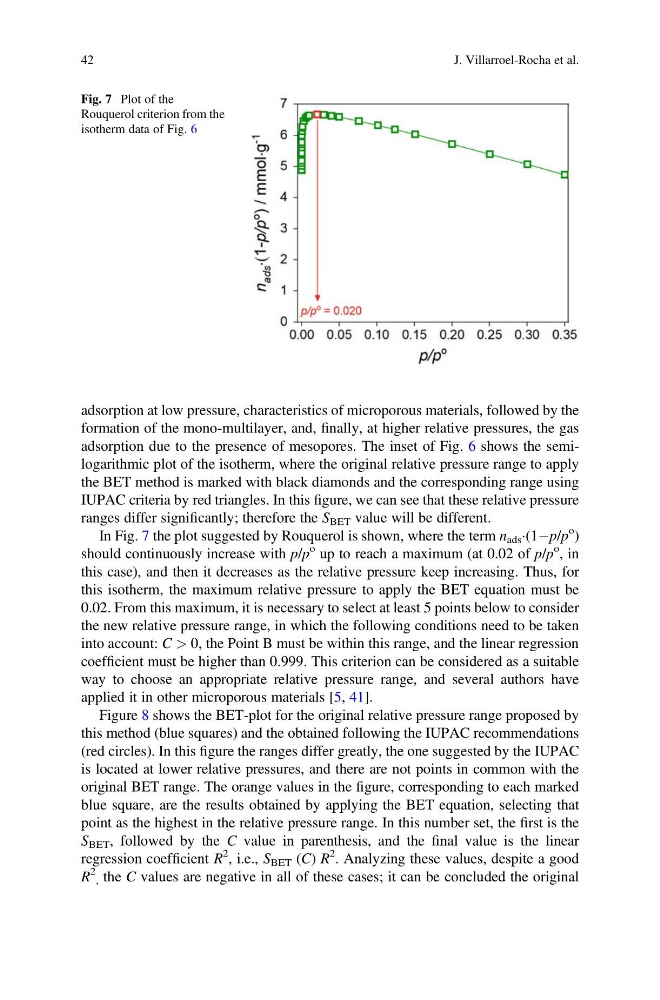
In Fig. 7 the plot suggested by Rouquerol is shown, where the term n ads Á(1Àp/p
o )
should continuously increase with p/p
o up to reach a maximum (at 0.02 of p/p
o , in
this case), and then it decreases as the relative pressure keep increasing. Thus, for
this isotherm, the maximum relative pressure to apply the BET equation must be
0.02. From this maximum, it is necessary to select at least 5 points below to consider
the new relative pressure range, in which the following conditions need to be taken
into account: C > 0, the Point B must be within this range, and the linear regression
coefficient must be higher than 0.999. This criterion can be considered as a suitable
way to choose an appropriate relative pressure range, and several authors have
applied it in other microporous materials [5, 41].
Figure 8 shows the BET-plot for the original relative pressure range proposed by
this method (blue squares) and the obtained following the IUPAC recommendations
(red circles). In this figure the ranges differ greatly, the one suggested by the IUPAC
is located at lower relative pressures, and there are not points in common with the
original BET range. The orange values in the figure, corresponding to each marked
blue square, are the results obtained by applying the BET equation, selecting that
point as the highest in the relative pressure range. In this number set, the first is the
S BET , followed by the C value in parenthesis, and the final value is the linear
regression coefficient R
2 , i.e., S BET (C) R
2 . Analyzing these values, despite a good
R
2
, the C values are negative in all of these cases; it can be concluded the original
Fig. 7 Plot of the
Rouquerol criterion from the
isotherm data of Fig. 6
42
J. Villarroel-Rocha et al.
formation of the mono-multilayer, and, finally, at higher relative pressures, the gas
adsorption due to the presence of mesopores. The inset of Fig. 6 shows the semilogarithmic plot of the isotherm, where the original relative pressure range to apply
the BET method is marked with black diamonds and the corresponding range using
IUPAC criteria by red triangles. In this figure, we can see that these relative pressure
ranges differ significantly; therefore the S BET value will be different.
In Fig. 7 the plot suggested by Rouquerol is shown, where the term n ads Á(1Àp/p
o )
should continuously increase with p/p
o up to reach a maximum (at 0.02 of p/p
o , in
this case), and then it decreases as the relative pressure keep increasing. Thus, for
this isotherm, the maximum relative pressure to apply the BET equation must be
0.02. From this maximum, it is necessary to select at least 5 points below to consider
the new relative pressure range, in which the following conditions need to be taken
into account: C > 0, the Point B must be within this range, and the linear regression
coefficient must be higher than 0.999. This criterion can be considered as a suitable
way to choose an appropriate relative pressure range, and several authors have
applied it in other microporous materials [5, 41].
Figure 8 shows the BET-plot for the original relative pressure range proposed by
this method (blue squares) and the obtained following the IUPAC recommendations
(red circles). In this figure the ranges differ greatly, the one suggested by the IUPAC
is located at lower relative pressures, and there are not points in common with the
original BET range. The orange values in the figure, corresponding to each marked
blue square, are the results obtained by applying the BET equation, selecting that
point as the highest in the relative pressure range. In this number set, the first is the
S BET , followed by the C value in parenthesis, and the final value is the linear
regression coefficient R
2 , i.e., S BET (C) R
2 . Analyzing these values, despite a good
R
2
, the C values are negative in all of these cases; it can be concluded the original
Fig. 7 Plot of the
Rouquerol criterion from the
isotherm data of Fig. 6
42
J. Villarroel-Rocha et al.