

can be considered as the effective area available for adsorption of the specified
adsorptive.
In the case of microporous materials as the zeolites, extreme caution is necessary
because it could be impossible to separate the mono-multilayer adsorption and
micropore filling processes. The original range of relative pressures proposed by
the BET model is between 0.05 and 0.35, but it has been found that the linear region
of BET-plot is shorter and even appears below 0.05. Then, with an adsorption
isotherm data, different values of S BET can be achieved depending on the chosen
relative pressures range. If the only criterion to choose this range is to find a linear
behavior of the data in the BET-plot, then this selection could be subjective and even
wrong because we can find several linear sections at different relative pressure
ranges in the plot. Therefore, a linear fitting of the data is not enough, and other
parameters must be considered. Rouquerol et al. [28] proposed a useful procedure to
avoid any subjectivity in the evaluation of the specific surface area by the BET
method, which was included in the IUPAC recommendations [7]. This proposal is
based on the following criteria: (1) the C value should be positive, because negative
value lacks physical meaning; (2) the application of the BET method should be
restricted to the range where the term n adsÁ (1 – p/p
o ) continuously increases with p/
p
o ; (3) the p/p
o value corresponding to n m should be within the selected BET range.
This procedure allows a standard and reproducible method to obtain the S BET , where,
depending on the C value, different interpretations can be made. For example, for
0 < C < 150, S BET can be assumed as the real accessible surface area of the
adsorbent for the probe molecule. Nevertheless, for most zeolites that have a high
C value, the S BET value is considered as the apparent surface area, and it only may be
regarded as a useful “fingerprint” of the adsorbent and not related with a real
property.
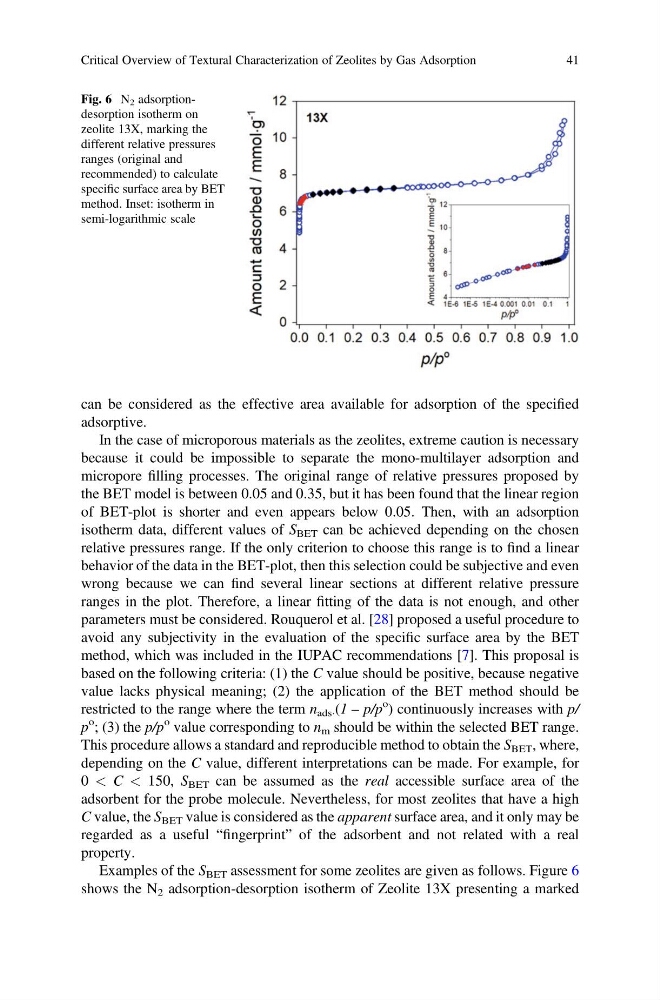
Examples of the S BET assessment for some zeolites are given as follows. Figure 6
shows the N 2 adsorption-desorption isotherm of Zeolite 13X presenting a marked
Fig. 6 N 2 adsorptiondesorption isotherm on
zeolite 13X, marking the
different relative pressures
ranges (original and
recommended) to calculate
specific surface area by BET
method. Inset: isotherm in
semi-logarithmic scale
Critical Overview of Textural Characterization of Zeolites by Gas Adsorption
41
adsorptive.
In the case of microporous materials as the zeolites, extreme caution is necessary
because it could be impossible to separate the mono-multilayer adsorption and
micropore filling processes. The original range of relative pressures proposed by
the BET model is between 0.05 and 0.35, but it has been found that the linear region
of BET-plot is shorter and even appears below 0.05. Then, with an adsorption
isotherm data, different values of S BET can be achieved depending on the chosen
relative pressures range. If the only criterion to choose this range is to find a linear
behavior of the data in the BET-plot, then this selection could be subjective and even
wrong because we can find several linear sections at different relative pressure
ranges in the plot. Therefore, a linear fitting of the data is not enough, and other
parameters must be considered. Rouquerol et al. [28] proposed a useful procedure to
avoid any subjectivity in the evaluation of the specific surface area by the BET
method, which was included in the IUPAC recommendations [7]. This proposal is
based on the following criteria: (1) the C value should be positive, because negative
value lacks physical meaning; (2) the application of the BET method should be
restricted to the range where the term n adsÁ (1 – p/p
o ) continuously increases with p/
p
o ; (3) the p/p
o value corresponding to n m should be within the selected BET range.
This procedure allows a standard and reproducible method to obtain the S BET , where,
depending on the C value, different interpretations can be made. For example, for
0 < C < 150, S BET can be assumed as the real accessible surface area of the
adsorbent for the probe molecule. Nevertheless, for most zeolites that have a high
C value, the S BET value is considered as the apparent surface area, and it only may be
regarded as a useful “fingerprint” of the adsorbent and not related with a real
property.
Examples of the S BET assessment for some zeolites are given as follows. Figure 6
shows the N 2 adsorption-desorption isotherm of Zeolite 13X presenting a marked
Fig. 6 N 2 adsorptiondesorption isotherm on
zeolite 13X, marking the
different relative pressures
ranges (original and
recommended) to calculate
specific surface area by BET
method. Inset: isotherm in
semi-logarithmic scale
Critical Overview of Textural Characterization of Zeolites by Gas Adsorption
41