

with the respective simulation for the system propane/propylene using binderless
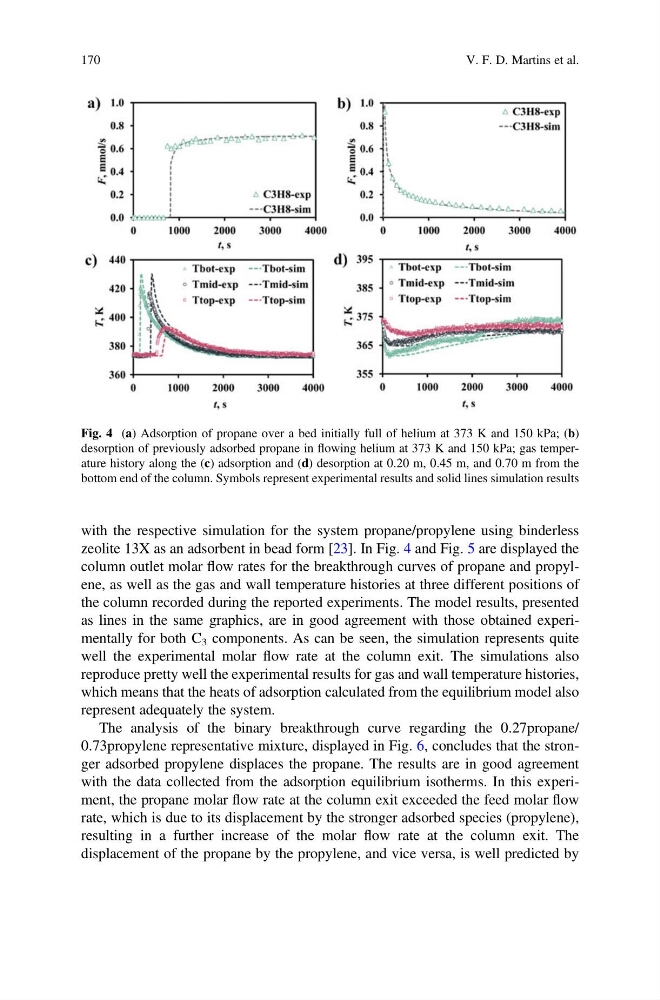
zeolite 13X as an adsorbent in bead form [23]. In Fig. 4 and Fig. 5 are displayed the
column outlet molar flow rates for the breakthrough curves of propane and propylene, as well as the gas and wall temperature histories at three different positions of
the column recorded during the reported experiments. The model results, presented
as lines in the same graphics, are in good agreement with those obtained experimentally for both C 3 components. As can be seen, the simulation represents quite
well the experimental molar flow rate at the column exit. The simulations also
reproduce pretty well the experimental results for gas and wall temperature histories,
which means that the heats of adsorption calculated from the equilibrium model also
represent adequately the system.
The analysis of the binary breakthrough curve regarding the 0.27propane/
0.73propylene representative mixture, displayed in Fig. 6, concludes that the stronger adsorbed propylene displaces the propane. The results are in good agreement
with the data collected from the adsorption equilibrium isotherms. In this experiment, the propane molar flow rate at the column exit exceeded the feed molar flow
rate, which is due to its displacement by the stronger adsorbed species (propylene),
resulting in a further increase of the molar flow rate at the column exit. The
displacement of the propane by the propylene, and vice versa, is well predicted by
Fig. 4 (a) Adsorption of propane over a bed initially full of helium at 373 K and 150 kPa; (b)
desorption of previously adsorbed propane in flowing helium at 373 K and 150 kPa; gas temperature history along the (c) adsorption and (d) desorption at 0.20 m, 0.45 m, and 0.70 m from the
bottom end of the column. Symbols represent experimental results and solid lines simulation results
170
V. F. D. Martins et al.
zeolite 13X as an adsorbent in bead form [23]. In Fig. 4 and Fig. 5 are displayed the
column outlet molar flow rates for the breakthrough curves of propane and propylene, as well as the gas and wall temperature histories at three different positions of
the column recorded during the reported experiments. The model results, presented
as lines in the same graphics, are in good agreement with those obtained experimentally for both C 3 components. As can be seen, the simulation represents quite
well the experimental molar flow rate at the column exit. The simulations also
reproduce pretty well the experimental results for gas and wall temperature histories,
which means that the heats of adsorption calculated from the equilibrium model also
represent adequately the system.
The analysis of the binary breakthrough curve regarding the 0.27propane/
0.73propylene representative mixture, displayed in Fig. 6, concludes that the stronger adsorbed propylene displaces the propane. The results are in good agreement
with the data collected from the adsorption equilibrium isotherms. In this experiment, the propane molar flow rate at the column exit exceeded the feed molar flow
rate, which is due to its displacement by the stronger adsorbed species (propylene),
resulting in a further increase of the molar flow rate at the column exit. The
displacement of the propane by the propylene, and vice versa, is well predicted by
Fig. 4 (a) Adsorption of propane over a bed initially full of helium at 373 K and 150 kPa; (b)
desorption of previously adsorbed propane in flowing helium at 373 K and 150 kPa; gas temperature history along the (c) adsorption and (d) desorption at 0.20 m, 0.45 m, and 0.70 m from the
bottom end of the column. Symbols represent experimental results and solid lines simulation results
170
V. F. D. Martins et al.