

concentration profile remains essentially flat and we are under equilibrium control.
The first limit allows the measurement of diffusion coefficients, and from the
definition of L, this requires small samples and high flowrates. For equilibrium
measurements, it is better to increase the volume of the sample and reduce the
flowrates.
While it is not possible to predict a priori which regime the experiments are in, a
plot of
c
c 0
vs Ft allows to see if the system is under equilibrium or kinetic control. If
the curves in this plot overlap, the system is under equilibrium control. Furthermore,
this plot can provide a simple check for consistency since the mass balance can be
integrated to obtain [8]:
V S q 0 þ V F c 0 ¼
Z 1
0
Fcdt
ð4Þ
The terms on the LHS represent the accumulation terms in the solid and fluid
phase, respectively, which are independent of flowrate, so the area under the curves
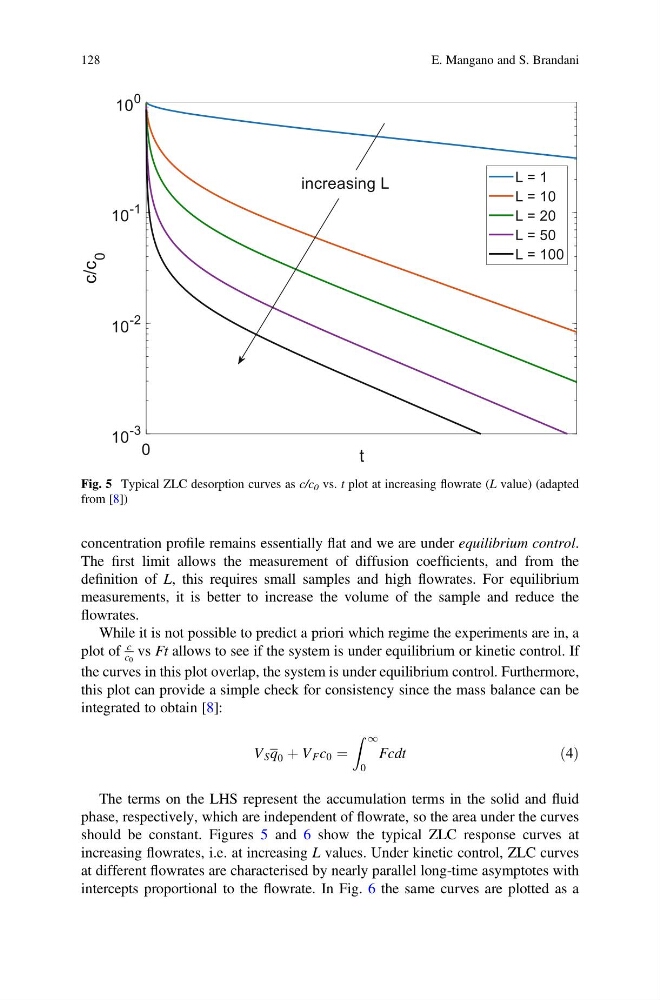
should be constant. Figures 5 and 6 show the typical ZLC response curves at
increasing flowrates, i.e. at increasing L values. Under kinetic control, ZLC curves
at different flowrates are characterised by nearly parallel long-time asymptotes with
intercepts proportional to the flowrate. In Fig. 6 the same curves are plotted as a
Fig. 5 Typical ZLC desorption curves as c/c 0 vs. t plot at increasing flowrate (L value) (adapted
from [8])
128
E. Mangano and S. Brandani
The first limit allows the measurement of diffusion coefficients, and from the
definition of L, this requires small samples and high flowrates. For equilibrium
measurements, it is better to increase the volume of the sample and reduce the
flowrates.
While it is not possible to predict a priori which regime the experiments are in, a
plot of
c
c 0
vs Ft allows to see if the system is under equilibrium or kinetic control. If
the curves in this plot overlap, the system is under equilibrium control. Furthermore,
this plot can provide a simple check for consistency since the mass balance can be
integrated to obtain [8]:
V S q 0 þ V F c 0 ¼
Z 1
0
Fcdt
ð4Þ
The terms on the LHS represent the accumulation terms in the solid and fluid
phase, respectively, which are independent of flowrate, so the area under the curves
should be constant. Figures 5 and 6 show the typical ZLC response curves at
increasing flowrates, i.e. at increasing L values. Under kinetic control, ZLC curves
at different flowrates are characterised by nearly parallel long-time asymptotes with
intercepts proportional to the flowrate. In Fig. 6 the same curves are plotted as a
Fig. 5 Typical ZLC desorption curves as c/c 0 vs. t plot at increasing flowrate (L value) (adapted
from [8])
128
E. Mangano and S. Brandani