

9 Struvite Crystallization: An Effective Technology …
157
Table 9.6 Effect of mixing intensity/speed on MAP recovery
Wastewater
type (V sample )
Mixing
speed/intensity
NH 4 −N (mg/L)
PO 4 −P (mg/L)
Reference
Initial
Removal
Initial
Removal
(%)
Synthetic
piggery
wastewater (2
L)
76 s −1
420
N.S. *
2.9
91.9
Wang et al.
(2006)
Semiconductor
wastewater
(2 L)
G · t d > 10 5
4
86%
99
70
Kim et al.
(2009)
10
88%
79
98%
Anaerobic
effluent of
dairy
processing
industry
(100 mL)
260 rpm
45
88.4%
0.36
79.3
Usyal and
Kuru
(2013)
* N.S.: Not studied
Table 9.7 Reduction of other pollution parameters during MAP recovery
Wastewater type
Reduction of pollution parameters (%)
References
COD
SS
TOC Colour Turbidity
Landfill leachate
80
N.S. N.S. N.S.
N.S.
Kabda¸ sli et al. (2000)
25.7
N.S. N.S. 22.5
36.4
Akkaya et al. (2010)
N.S.
N.S. N.S. 43
62
Gunay et al. (2008a)
10
80
N.S. N.S.
50
Gunay et al. (2008b)
5
N.S. N.S. N.S.
N.S.
Siciliano et al. (2013)
Semiconductor
wastewater
81, 66 * N.S. N.S. N.S.
N.S.
Ryu et al. (2008)
Poultry manure
wastewater
50
N.S. N.S. 49.8
N.S.
Yetilmezsoy and
Sapci-Zengin (2009)
Swine wastewater
22.1
N.S. 20.7 N.S.
N.S.
Zhang et al. (2012)
Dairy processing
wastewater
68.4
N.S. N.S. N.S.
N.S.
Usyal and Kuru
(2013)
* Total COD (81%), Soluble COD (66%). N.S.: Not studied
9.4.4 Contribution of Struvite Precipitation for Reduction
of Pollutants
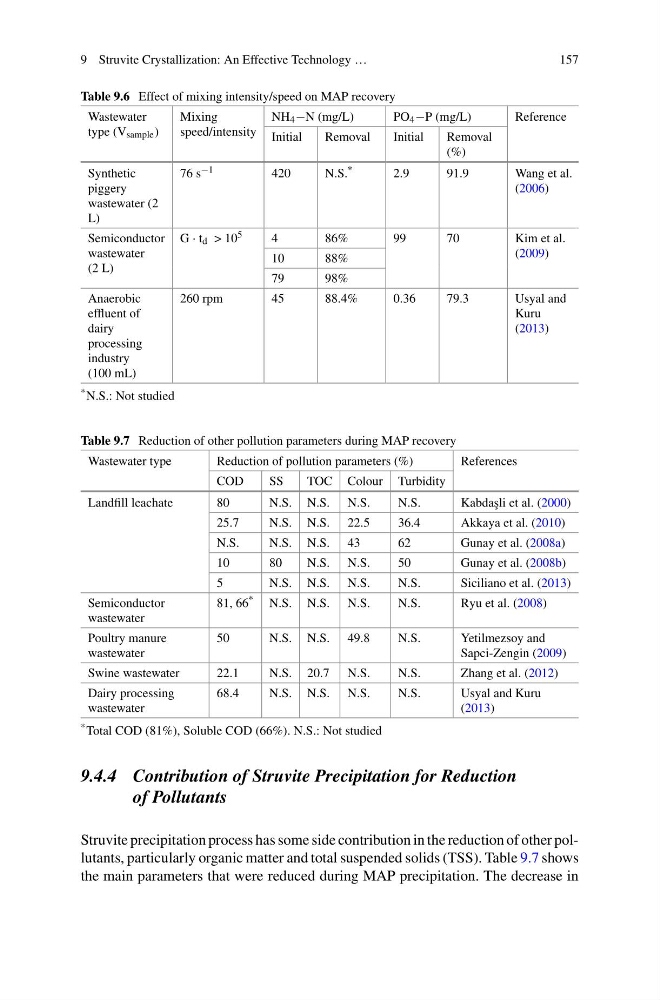
Struvite precipitation process has some side contribution in the reduction of other pollutants, particularly organic matter and total suspended solids (TSS). Table 9.7 shows
the main parameters that were reduced during MAP precipitation. The decrease in
157
Table 9.6 Effect of mixing intensity/speed on MAP recovery
Wastewater
type (V sample )
Mixing
speed/intensity
NH 4 −N (mg/L)
PO 4 −P (mg/L)
Reference
Initial
Removal
Initial
Removal
(%)
Synthetic
piggery
wastewater (2
L)
76 s −1
420
N.S. *
2.9
91.9
Wang et al.
(2006)
Semiconductor
wastewater
(2 L)
G · t d > 10 5
4
86%
99
70
Kim et al.
(2009)
10
88%
79
98%
Anaerobic
effluent of
dairy
processing
industry
(100 mL)
260 rpm
45
88.4%
0.36
79.3
Usyal and
Kuru
(2013)
* N.S.: Not studied
Table 9.7 Reduction of other pollution parameters during MAP recovery
Wastewater type
Reduction of pollution parameters (%)
References
COD
SS
TOC Colour Turbidity
Landfill leachate
80
N.S. N.S. N.S.
N.S.
Kabda¸ sli et al. (2000)
25.7
N.S. N.S. 22.5
36.4
Akkaya et al. (2010)
N.S.
N.S. N.S. 43
62
Gunay et al. (2008a)
10
80
N.S. N.S.
50
Gunay et al. (2008b)
5
N.S. N.S. N.S.
N.S.
Siciliano et al. (2013)
Semiconductor
wastewater
81, 66 * N.S. N.S. N.S.
N.S.
Ryu et al. (2008)
Poultry manure
wastewater
50
N.S. N.S. 49.8
N.S.
Yetilmezsoy and
Sapci-Zengin (2009)
Swine wastewater
22.1
N.S. 20.7 N.S.
N.S.
Zhang et al. (2012)
Dairy processing
wastewater
68.4
N.S. N.S. N.S.
N.S.
Usyal and Kuru
(2013)
* Total COD (81%), Soluble COD (66%). N.S.: Not studied
9.4.4 Contribution of Struvite Precipitation for Reduction
of Pollutants
Struvite precipitation process has some side contribution in the reduction of other pollutants, particularly organic matter and total suspended solids (TSS). Table 9.7 shows
the main parameters that were reduced during MAP precipitation. The decrease in