

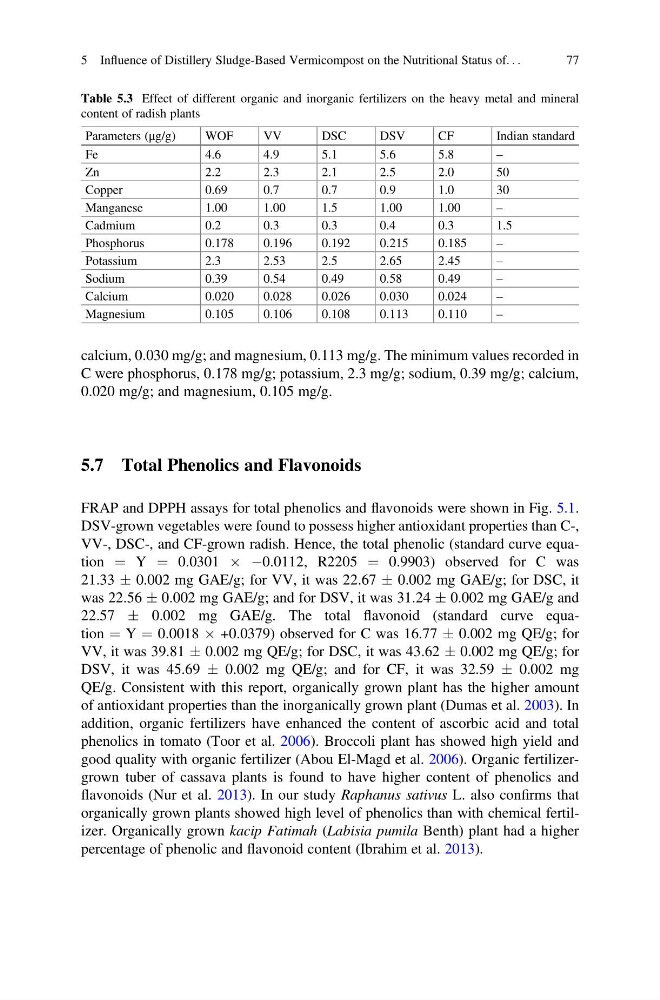
calcium, 0.030 mg/g; and magnesium, 0.113 mg/g. The minimum values recorded in
C were phosphorus, 0.178 mg/g; potassium, 2.3 mg/g; sodium, 0.39 mg/g; calcium,
0.020 mg/g; and magnesium, 0.105 mg/g.
5.7 Total Phenolics and Flavonoids
FRAP and DPPH assays for total phenolics and flavonoids were shown in Fig. 5.1.
DSV-grown vegetables were found to possess higher antioxidant properties than C-,
VV-, DSC-, and CF-grown radish. Hence, the total phenolic (standard curve equation ¼ Y ¼ 0.0301 Â À0.0112, R2205 ¼ 0.9903) observed for C was
21.33 Æ 0.002 mg GAE/g; for VV, it was 22.67 Æ 0.002 mg GAE/g; for DSC, it
was 22.56 Æ 0.002 mg GAE/g; and for DSV, it was 31.24 Æ 0.002 mg GAE/g and
22.57 Æ 0.002 mg GAE/g. The total flavonoid (standard curve equation ¼ Y ¼ 0.0018 Â +0.0379) observed for C was 16.77 Æ 0.002 mg QE/g; for
VV, it was 39.81 Æ 0.002 mg QE/g; for DSC, it was 43.62 Æ 0.002 mg QE/g; for
DSV, it was 45.69 Æ 0.002 mg QE/g; and for CF, it was 32.59 Æ 0.002 mg
QE/g. Consistent with this report, organically grown plant has the higher amount
of antioxidant properties than the inorganically grown plant (Dumas et al. 2003). In
addition, organic fertilizers have enhanced the content of ascorbic acid and total
phenolics in tomato (Toor et al. 2006). Broccoli plant has showed high yield and
good quality with organic fertilizer (Abou El-Magd et al. 2006). Organic fertilizergrown tuber of cassava plants is found to have higher content of phenolics and
flavonoids (Nur et al. 2013). In our study Raphanus sativus L. also confirms that
organically grown plants showed high level of phenolics than with chemical fertilizer. Organically grown kacip Fatimah (Labisia pumila Benth) plant had a higher
percentage of phenolic and flavonoid content (Ibrahim et al. 2013).
Table 5.3 Effect of different organic and inorganic fertilizers on the heavy metal and mineral
content of radish plants
Parameters (μg/g)
WOF
VV
DSC
DSV
CF
Indian standard
Fe
4.6
4.9
5.1
5.6
5.8
–
Zn
2.2
2.3
2.1
2.5
2.0
50
Copper
0.69
0.7
0.7
0.9
1.0
30
Manganese
1.00
1.00
1.5
1.00
1.00
–
Cadmium
0.2
0.3
0.3
0.4
0.3
1.5
Phosphorus
0.178
0.196
0.192
0.215
0.185
–
Potassium
2.3
2.53
2.5
2.65
2.45
–
Sodium
0.39
0.54
0.49
0.58
0.49
–
Calcium
0.020
0.028
0.026
0.030
0.024
–
Magnesium
0.105
0.106
0.108
0.113
0.110
–
5 Influence of Distillery Sludge-Based Vermicompost on the Nutritional Status of. . .
77
C were phosphorus, 0.178 mg/g; potassium, 2.3 mg/g; sodium, 0.39 mg/g; calcium,
0.020 mg/g; and magnesium, 0.105 mg/g.
5.7 Total Phenolics and Flavonoids
FRAP and DPPH assays for total phenolics and flavonoids were shown in Fig. 5.1.
DSV-grown vegetables were found to possess higher antioxidant properties than C-,
VV-, DSC-, and CF-grown radish. Hence, the total phenolic (standard curve equation ¼ Y ¼ 0.0301 Â À0.0112, R2205 ¼ 0.9903) observed for C was
21.33 Æ 0.002 mg GAE/g; for VV, it was 22.67 Æ 0.002 mg GAE/g; for DSC, it
was 22.56 Æ 0.002 mg GAE/g; and for DSV, it was 31.24 Æ 0.002 mg GAE/g and
22.57 Æ 0.002 mg GAE/g. The total flavonoid (standard curve equation ¼ Y ¼ 0.0018 Â +0.0379) observed for C was 16.77 Æ 0.002 mg QE/g; for
VV, it was 39.81 Æ 0.002 mg QE/g; for DSC, it was 43.62 Æ 0.002 mg QE/g; for
DSV, it was 45.69 Æ 0.002 mg QE/g; and for CF, it was 32.59 Æ 0.002 mg
QE/g. Consistent with this report, organically grown plant has the higher amount
of antioxidant properties than the inorganically grown plant (Dumas et al. 2003). In
addition, organic fertilizers have enhanced the content of ascorbic acid and total
phenolics in tomato (Toor et al. 2006). Broccoli plant has showed high yield and
good quality with organic fertilizer (Abou El-Magd et al. 2006). Organic fertilizergrown tuber of cassava plants is found to have higher content of phenolics and
flavonoids (Nur et al. 2013). In our study Raphanus sativus L. also confirms that
organically grown plants showed high level of phenolics than with chemical fertilizer. Organically grown kacip Fatimah (Labisia pumila Benth) plant had a higher
percentage of phenolic and flavonoid content (Ibrahim et al. 2013).
Table 5.3 Effect of different organic and inorganic fertilizers on the heavy metal and mineral
content of radish plants
Parameters (μg/g)
WOF
VV
DSC
DSV
CF
Indian standard
Fe
4.6
4.9
5.1
5.6
5.8
–
Zn
2.2
2.3
2.1
2.5
2.0
50
Copper
0.69
0.7
0.7
0.9
1.0
30
Manganese
1.00
1.00
1.5
1.00
1.00
–
Cadmium
0.2
0.3
0.3
0.4
0.3
1.5
Phosphorus
0.178
0.196
0.192
0.215
0.185
–
Potassium
2.3
2.53
2.5
2.65
2.45
–
Sodium
0.39
0.54
0.49
0.58
0.49
–
Calcium
0.020
0.028
0.026
0.030
0.024
–
Magnesium
0.105
0.106
0.108
0.113
0.110
–
5 Influence of Distillery Sludge-Based Vermicompost on the Nutritional Status of. . .
77