

76
In contrast, during an actual deep-sea blowout, the crude oil is supposed to be
already highly supersaturated and contain bubble nuclei at the blowout site. In the
case of the DWH blowout, the reservoir pressure at which the oil was saturated with
natural gas was at least about 70 MPa (Hickman et al. 2012). As the oil flows
upward, the pressure decreases leastwise 55 MPa from the bubble point curve into
the two-phase region – this is certainly enough supersaturation for the creation of
bubble nuclei and actual gas bubbles, which is besides proved by the huge amounts
of free gas during the blowout (Satter 2016). Furthermore, over the last section of
the broken riser stub, the so-called blowout preventer, a sudden pressure drop of
approximately 8.6 MPa occurred, and the flow conditions were highly turbulent,
facilitating bubble nucleation (Aliseda et al. 2010). The calculated curves correspond to an actual blowout with the presence of bubble nuclei due to high supersaturation and shear forces.
The extension of the experimental plant at Hamburg University of Technology,
indicated by the dashed box in Fig. 5.4, accounts for the high pressure levels inside
oil reservoirs and the pressure release before the oil exits the broken riser into the
water column. A back pressure regulator enables a pressure release from a saturation pressure of 25.1 MPa to the respective initial pressure of the experiments that
are conducted and evaluated like before. With this extended setup, no initial shrinking is observed, but the droplets are growing increasingly from the beginning of the
experiments during the continuous pressure release. Apparently, the nucleation barrier is already overcome when the droplets are generated. The experimental results
represent the predicted curve quite well with much higher diameter ratios d p /d p, 0
than before that now lie within the range predicted by means of the presented
procedure.
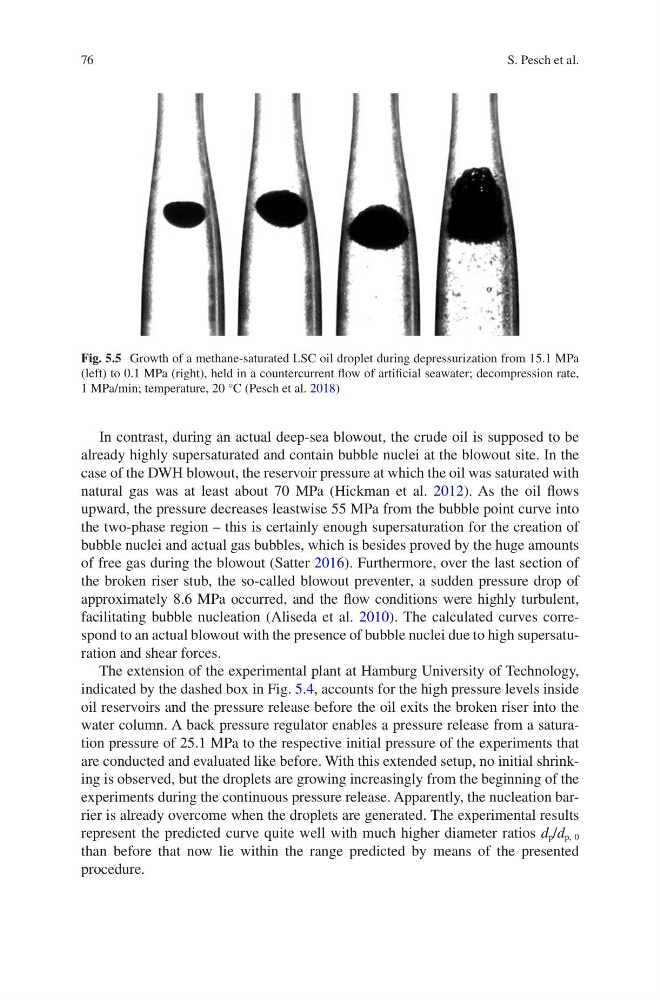
Fig. 5.5 Growth of a methane-saturated LSC oil droplet during depressurization from 15.1 MPa
(left) to 0.1 MPa (right), held in a countercurrent flow of artificial seawater; decompression rate,
1 MPa/min; temperature, 20 °C (Pesch et al. 2018)
S. Pesch et al.
In contrast, during an actual deep-sea blowout, the crude oil is supposed to be
already highly supersaturated and contain bubble nuclei at the blowout site. In the
case of the DWH blowout, the reservoir pressure at which the oil was saturated with
natural gas was at least about 70 MPa (Hickman et al. 2012). As the oil flows
upward, the pressure decreases leastwise 55 MPa from the bubble point curve into
the two-phase region – this is certainly enough supersaturation for the creation of
bubble nuclei and actual gas bubbles, which is besides proved by the huge amounts
of free gas during the blowout (Satter 2016). Furthermore, over the last section of
the broken riser stub, the so-called blowout preventer, a sudden pressure drop of
approximately 8.6 MPa occurred, and the flow conditions were highly turbulent,
facilitating bubble nucleation (Aliseda et al. 2010). The calculated curves correspond to an actual blowout with the presence of bubble nuclei due to high supersaturation and shear forces.
The extension of the experimental plant at Hamburg University of Technology,
indicated by the dashed box in Fig. 5.4, accounts for the high pressure levels inside
oil reservoirs and the pressure release before the oil exits the broken riser into the
water column. A back pressure regulator enables a pressure release from a saturation pressure of 25.1 MPa to the respective initial pressure of the experiments that
are conducted and evaluated like before. With this extended setup, no initial shrinking is observed, but the droplets are growing increasingly from the beginning of the
experiments during the continuous pressure release. Apparently, the nucleation barrier is already overcome when the droplets are generated. The experimental results
represent the predicted curve quite well with much higher diameter ratios d p /d p, 0
than before that now lie within the range predicted by means of the presented
procedure.
Fig. 5.5 Growth of a methane-saturated LSC oil droplet during depressurization from 15.1 MPa
(left) to 0.1 MPa (right), held in a countercurrent flow of artificial seawater; decompression rate,
1 MPa/min; temperature, 20 °C (Pesch et al. 2018)
S. Pesch et al.