

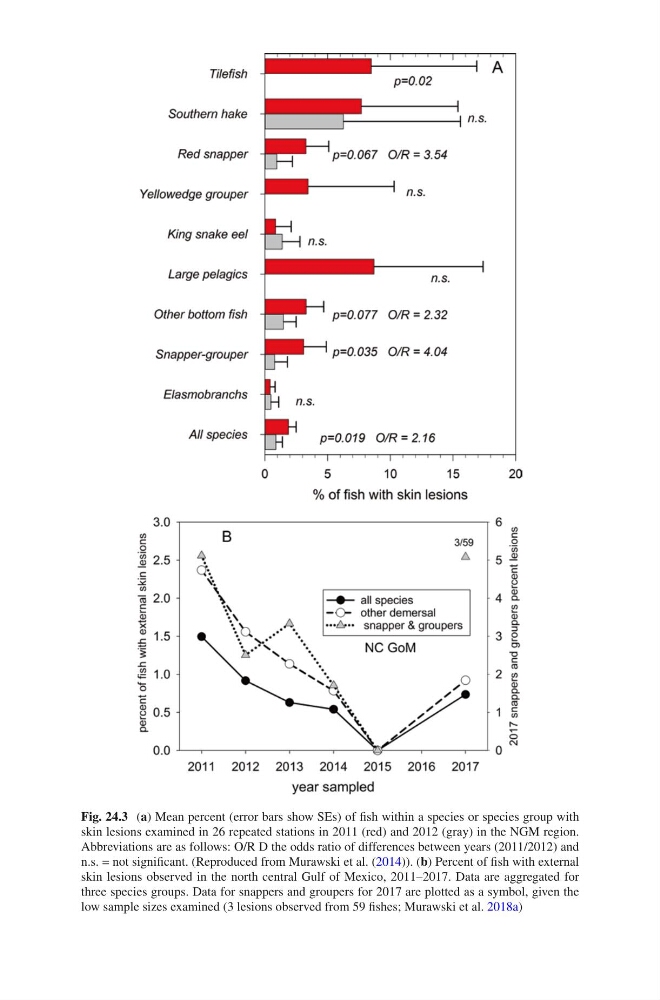
Fig. 24.3 (a) Mean percent (error bars show SEs) of fish within a species or species group with
skin lesions examined in 26 repeated stations in 2011 (red) and 2012 (gray) in the NGM region.
Abbreviations are as follows: O/R D the odds ratio of differences between years (2011/2012) and
n.s. = not significant. (Reproduced from Murawski et al. (2014)). (b) Percent of fish with external
skin lesions observed in the north central Gulf of Mexico, 2011–2017. Data are aggregated for
three species groups. Data for snappers and groupers for 2017 are plotted as a symbol, given the
low sample sizes examined (3 lesions observed from 59 fishes; Murawski et al. 2018a)
skin lesions examined in 26 repeated stations in 2011 (red) and 2012 (gray) in the NGM region.
Abbreviations are as follows: O/R D the odds ratio of differences between years (2011/2012) and
n.s. = not significant. (Reproduced from Murawski et al. (2014)). (b) Percent of fish with external
skin lesions observed in the north central Gulf of Mexico, 2011–2017. Data are aggregated for
three species groups. Data for snappers and groupers for 2017 are plotted as a symbol, given the
low sample sizes examined (3 lesions observed from 59 fishes; Murawski et al. 2018a)