

243
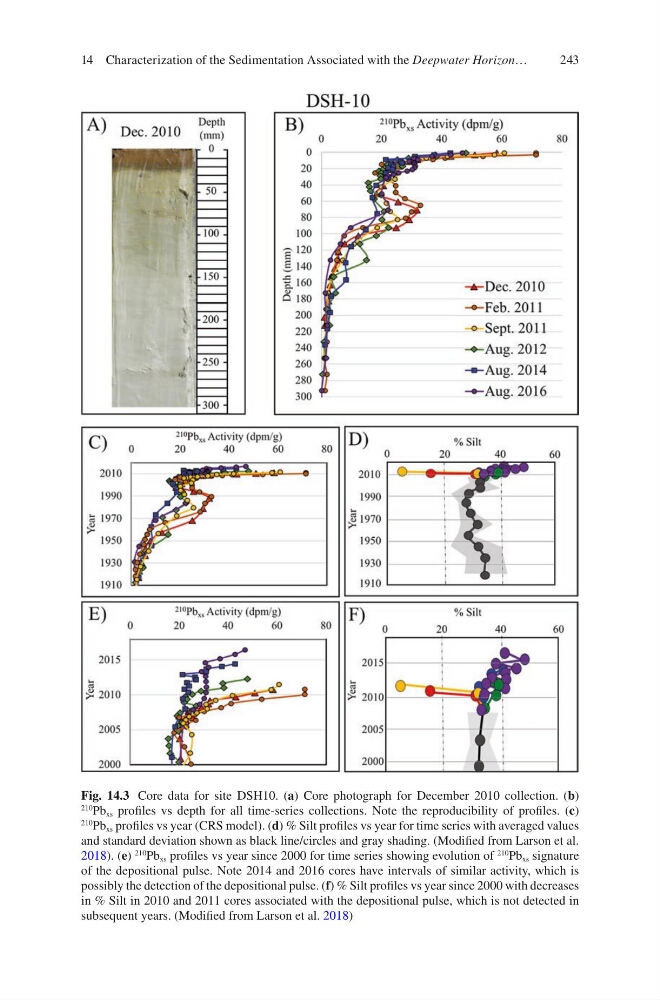
Fig. 14.3 Core data for site DSH10. (a) Core photograph for December 2010 collection. (b)
210 Pb xs profiles vs depth for all time-series collections. Note the reproducibility of profiles. (c)
210 Pb xs profiles vs year (CRS model). (d) % Silt profiles vs year for time series with averaged values
and standard deviation shown as black line/circles and gray shading. (Modified from Larson et al.
2018). (e)
210
Pb xs profiles vs year since 2000 for time series showing evolution of
210
Pb xs signature
of the depositional pulse. Note 2014 and 2016 cores have intervals of similar activity, which is
possibly the detection of the depositional pulse. (f) % Silt profiles vs year since 2000 with decreases
in % Silt in 2010 and 2011 cores associated with the depositional pulse, which is not detected in
subsequent years. (Modified from Larson et al. 2018)
14 Characterization of the Sedimentation Associated with the Deepwater Horizon…
Fig. 14.3 Core data for site DSH10. (a) Core photograph for December 2010 collection. (b)
210 Pb xs profiles vs depth for all time-series collections. Note the reproducibility of profiles. (c)
210 Pb xs profiles vs year (CRS model). (d) % Silt profiles vs year for time series with averaged values
and standard deviation shown as black line/circles and gray shading. (Modified from Larson et al.
2018). (e)
210
Pb xs profiles vs year since 2000 for time series showing evolution of
210
Pb xs signature
of the depositional pulse. Note 2014 and 2016 cores have intervals of similar activity, which is
possibly the detection of the depositional pulse. (f) % Silt profiles vs year since 2000 with decreases
in % Silt in 2010 and 2011 cores associated with the depositional pulse, which is not detected in
subsequent years. (Modified from Larson et al. 2018)
14 Characterization of the Sedimentation Associated with the Deepwater Horizon…