

242
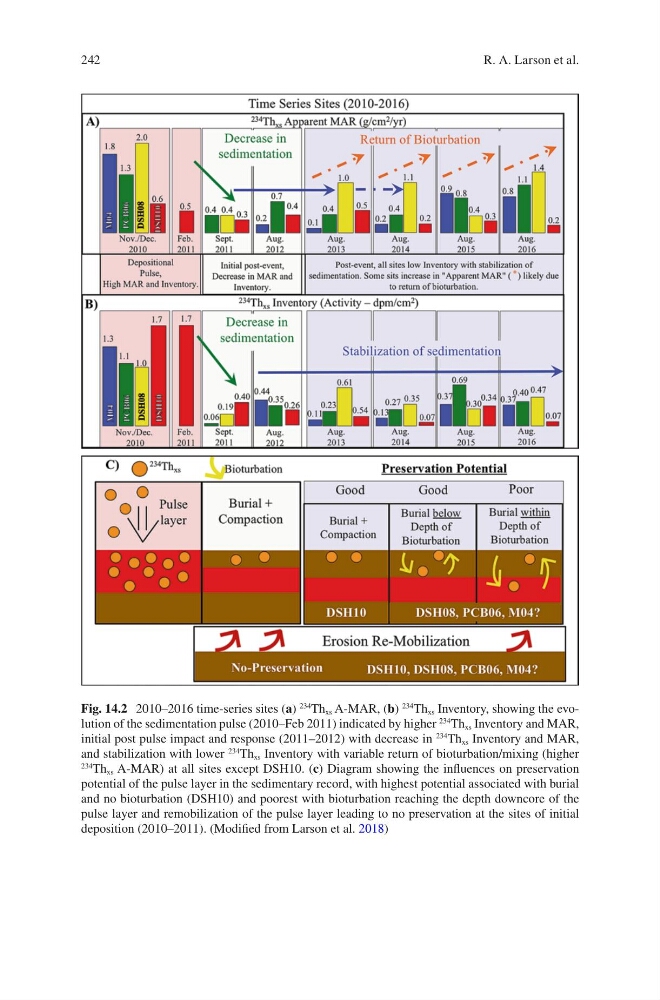
Fig. 14.2 2010–2016 time-series sites (a)
234
Th xs A-MAR, (b)
234 Th xs Inventory, showing the evolution of the sedimentation pulse (2010–Feb 2011) indicated by higher
234
Th xs Inventory and MAR,
initial post pulse impact and response (2011–2012) with decrease in
234
Th xs Inventory and MAR,
and stabilization with lower
234 Th xs Inventory with variable return of bioturbation/mixing (higher
234 Th xs A-MAR) at all sites except DSH10. (c) Diagram showing the influences on preservation
potential of the pulse layer in the sedimentary record, with highest potential associated with burial
and no bioturbation (DSH10) and poorest with bioturbation reaching the depth downcore of the
pulse layer and remobilization of the pulse layer leading to no preservation at the sites of initial
deposition (2010–2011). (Modified from Larson et al. 2018)
R. A. Larson et al.
Fig. 14.2 2010–2016 time-series sites (a)
234
Th xs A-MAR, (b)
234 Th xs Inventory, showing the evolution of the sedimentation pulse (2010–Feb 2011) indicated by higher
234
Th xs Inventory and MAR,
initial post pulse impact and response (2011–2012) with decrease in
234
Th xs Inventory and MAR,
and stabilization with lower
234 Th xs Inventory with variable return of bioturbation/mixing (higher
234 Th xs A-MAR) at all sites except DSH10. (c) Diagram showing the influences on preservation
potential of the pulse layer in the sedimentary record, with highest potential associated with burial
and no bioturbation (DSH10) and poorest with bioturbation reaching the depth downcore of the
pulse layer and remobilization of the pulse layer leading to no preservation at the sites of initial
deposition (2010–2011). (Modified from Larson et al. 2018)
R. A. Larson et al.