

180
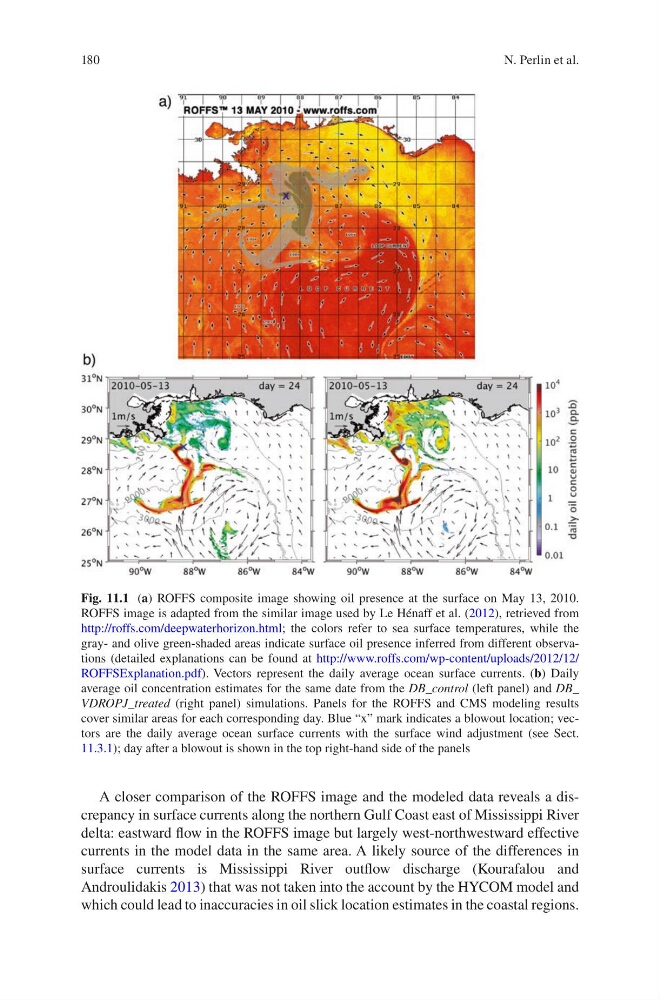
A closer comparison of the ROFFS image and the modeled data reveals a discrepancy in surface currents along the northern Gulf Coast east of Mississippi River
delta: eastward flow in the ROFFS image but largely west-northwestward effective
currents in the model data in the same area. A likely source of the differences in
surface currents is Mississippi River outflow discharge (Kourafalou and
Androulidakis 2013) that was not taken into the account by the HYCOM model and
which could lead to inaccuracies in oil slick location estimates in the coastal regions.
Fig. 11.1 (a) ROFFS composite image showing oil presence at the surface on May 13, 2010.
ROFFS image is adapted from the similar image used by Le Hénaff et al. (2012), retrieved from
http://roffs.com/deepwaterhorizon.html; the colors refer to sea surface temperatures, while the
gray- and olive green-shaded areas indicate surface oil presence inferred from different observations (detailed explanations can be found at http://www.roffs.com/wp-content/uploads/2012/12/
ROFFSExplanation.pdf). Vectors represent the daily average ocean surface currents. (b) Daily
average oil concentration estimates for the same date from the DB_control (left panel) and DB_
VDROPJ_treated (right panel) simulations. Panels for the ROFFS and CMS modeling results
cover similar areas for each corresponding day. Blue “x” mark indicates a blowout location; vectors are the daily average ocean surface currents with the surface wind adjustment (see Sect.
11.3.1); day after a blowout is shown in the top right-hand side of the panels
N. Perlin et al.
A closer comparison of the ROFFS image and the modeled data reveals a discrepancy in surface currents along the northern Gulf Coast east of Mississippi River
delta: eastward flow in the ROFFS image but largely west-northwestward effective
currents in the model data in the same area. A likely source of the differences in
surface currents is Mississippi River outflow discharge (Kourafalou and
Androulidakis 2013) that was not taken into the account by the HYCOM model and
which could lead to inaccuracies in oil slick location estimates in the coastal regions.
Fig. 11.1 (a) ROFFS composite image showing oil presence at the surface on May 13, 2010.
ROFFS image is adapted from the similar image used by Le Hénaff et al. (2012), retrieved from
http://roffs.com/deepwaterhorizon.html; the colors refer to sea surface temperatures, while the
gray- and olive green-shaded areas indicate surface oil presence inferred from different observations (detailed explanations can be found at http://www.roffs.com/wp-content/uploads/2012/12/
ROFFSExplanation.pdf). Vectors represent the daily average ocean surface currents. (b) Daily
average oil concentration estimates for the same date from the DB_control (left panel) and DB_
VDROPJ_treated (right panel) simulations. Panels for the ROFFS and CMS modeling results
cover similar areas for each corresponding day. Blue “x” mark indicates a blowout location; vectors are the daily average ocean surface currents with the surface wind adjustment (see Sect.
11.3.1); day after a blowout is shown in the top right-hand side of the panels
N. Perlin et al.