

38
2 High-Efficient Anaerobic Fermentation Technology of Organic …
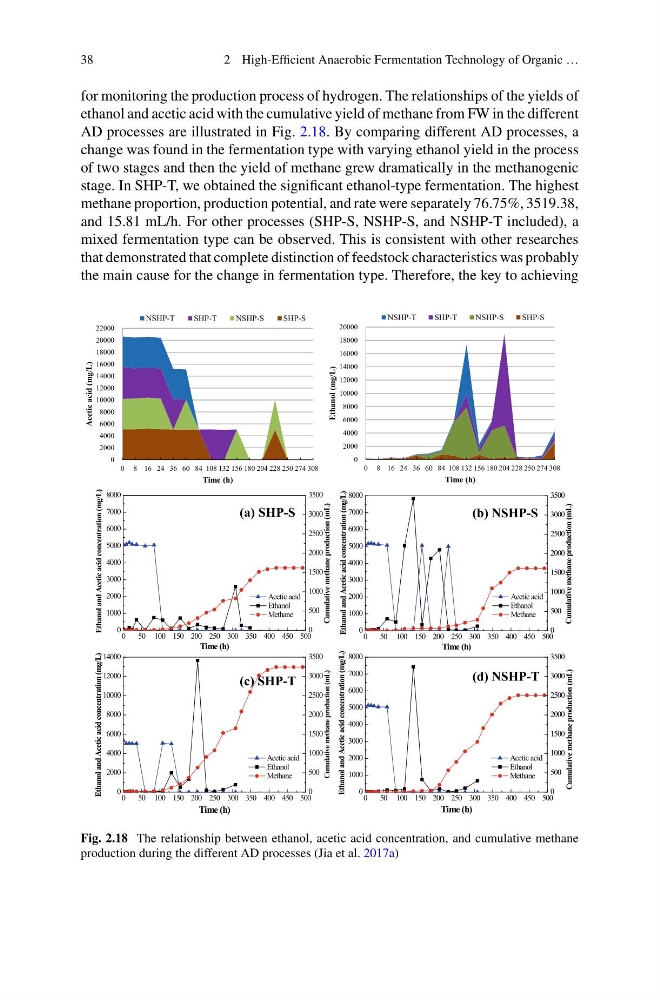
for monitoring the production process of hydrogen. The relationships of the yields of
ethanol and acetic acid with the cumulative yield of methane from FW in the different
AD processes are illustrated in Fig. 2.18. By comparing different AD processes, a
change was found in the fermentation type with varying ethanol yield in the process
of two stages and then the yield of methane grew dramatically in the methanogenic
stage. In SHP-T, we obtained the significant ethanol-type fermentation. The highest
methane proportion, production potential, and rate were separately 76.75%, 3519.38,
and 15.81 mL/h. For other processes (SHP-S, NSHP-S, and NSHP-T included), a
mixed fermentation type can be observed. This is consistent with other researches
that demonstrated that complete distinction of feedstock characteristics was probably
the main cause for the change in fermentation type. Therefore, the key to achieving
0
50 100 150 200 250 300 350 400 450 500
0
2000
4000
6000
8000
10000
12000
14000
Cumulative methane production (mL)
Ethanol and Acetic acid concentration (mg/L)
Time (h)
Acetic acid
Ethanol
Methane
0
500
1000
1500
2000
2500
3000
3500
0
50 100 150 200 250 300 350 400 450 500
0
1000
2000
3000
4000
5000
6000
7000
8000
Cumulative methane production (mL)
Time (h)
Acetic acid
Ethanol
Methane
0
500
1000
1500
2000
2500
3000
3500
Ethanol and Acetic acid concentration (mg/L)
0
50 100 150 200 250 300 350 400 450 500
0
1000
2000
3000
4000
5000
6000
7000
8000
Cumulative methane production (mL)
Ethanol and Acetic acid concentration (mg/L)
Time (h)
Acetic acid
Ethanol
Methane
0
500
1000
1500
2000
2500
3000
3500
0
50 100 150 200 250 300 350 400 450 500
0
1000
2000
3000
4000
5000
6000
7000
8000
Cumulative methane production (mL)
Ethanol and Acetic acid concentration (mg/L)
Time (h)
Acetic acid
Ethanol
Methane
0
500
1000
1500
2000
2500
3000
3500
(b) NSHP-S
(c) SHP-T
(d) NSHP-T
(a) SHP-S
0
2000
4000
6000
8000
10000
12000
14000
16000
18000
20000
22000
0 8 16 24 36 60 84 108 132 156 180 204 228 250 274 308
Acetic acid (mg/L)
Time (h)
NSHP-T
SHP-T
NSHP-S
SHP-S
0
2000
4000
6000
8000
10000
12000
14000
16000
18000
20000
0 8 16 24 36 60 84 108 132 156 180 204 228 250 274 308
Ethanol (mg/L)
Time (h)
NSHP-T
SHP-T
NSHP-S
SHP-S
Fig. 2.18 The relationship between ethanol, acetic acid concentration, and cumulative methane
production during the different AD processes (Jia et al. 2017a)
2 High-Efficient Anaerobic Fermentation Technology of Organic …
for monitoring the production process of hydrogen. The relationships of the yields of
ethanol and acetic acid with the cumulative yield of methane from FW in the different
AD processes are illustrated in Fig. 2.18. By comparing different AD processes, a
change was found in the fermentation type with varying ethanol yield in the process
of two stages and then the yield of methane grew dramatically in the methanogenic
stage. In SHP-T, we obtained the significant ethanol-type fermentation. The highest
methane proportion, production potential, and rate were separately 76.75%, 3519.38,
and 15.81 mL/h. For other processes (SHP-S, NSHP-S, and NSHP-T included), a
mixed fermentation type can be observed. This is consistent with other researches
that demonstrated that complete distinction of feedstock characteristics was probably
the main cause for the change in fermentation type. Therefore, the key to achieving
0
50 100 150 200 250 300 350 400 450 500
0
2000
4000
6000
8000
10000
12000
14000
Cumulative methane production (mL)
Ethanol and Acetic acid concentration (mg/L)
Time (h)
Acetic acid
Ethanol
Methane
0
500
1000
1500
2000
2500
3000
3500
0
50 100 150 200 250 300 350 400 450 500
0
1000
2000
3000
4000
5000
6000
7000
8000
Cumulative methane production (mL)
Time (h)
Acetic acid
Ethanol
Methane
0
500
1000
1500
2000
2500
3000
3500
Ethanol and Acetic acid concentration (mg/L)
0
50 100 150 200 250 300 350 400 450 500
0
1000
2000
3000
4000
5000
6000
7000
8000
Cumulative methane production (mL)
Ethanol and Acetic acid concentration (mg/L)
Time (h)
Acetic acid
Ethanol
Methane
0
500
1000
1500
2000
2500
3000
3500
0
50 100 150 200 250 300 350 400 450 500
0
1000
2000
3000
4000
5000
6000
7000
8000
Cumulative methane production (mL)
Ethanol and Acetic acid concentration (mg/L)
Time (h)
Acetic acid
Ethanol
Methane
0
500
1000
1500
2000
2500
3000
3500
(b) NSHP-S
(c) SHP-T
(d) NSHP-T
(a) SHP-S
0
2000
4000
6000
8000
10000
12000
14000
16000
18000
20000
22000
0 8 16 24 36 60 84 108 132 156 180 204 228 250 274 308
Acetic acid (mg/L)
Time (h)
NSHP-T
SHP-T
NSHP-S
SHP-S
0
2000
4000
6000
8000
10000
12000
14000
16000
18000
20000
0 8 16 24 36 60 84 108 132 156 180 204 228 250 274 308
Ethanol (mg/L)
Time (h)
NSHP-T
SHP-T
NSHP-S
SHP-S
Fig. 2.18 The relationship between ethanol, acetic acid concentration, and cumulative methane
production during the different AD processes (Jia et al. 2017a)