

34
2 High-Efficient Anaerobic Fermentation Technology of Organic …
highest concentration (5.37 g/L), probably threatening the efficiency of anaerobic
digestion.
2.2.3.4 Influences of Pre-treatment on DOM
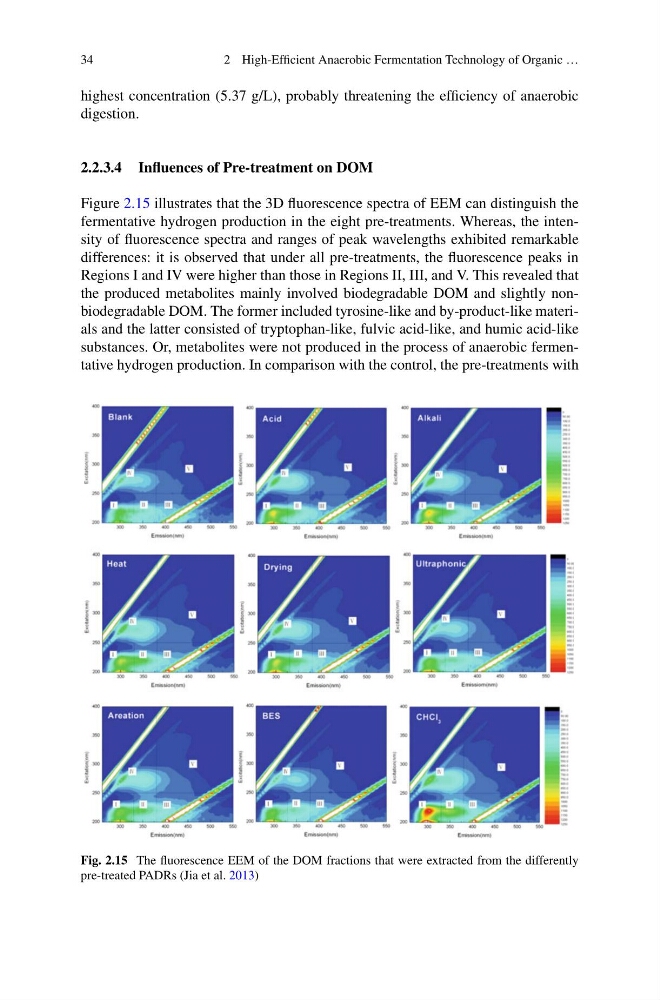
Figure 2.15 illustrates that the 3D fluorescence spectra of EEM can distinguish the
fermentative hydrogen production in the eight pre-treatments. Whereas, the intensity of fluorescence spectra and ranges of peak wavelengths exhibited remarkable
differences: it is observed that under all pre-treatments, the fluorescence peaks in
Regions I and IV were higher than those in Regions II, III, and V. This revealed that
the produced metabolites mainly involved biodegradable DOM and slightly nonbiodegradable DOM. The former included tyrosine-like and by-product-like materials and the latter consisted of tryptophan-like, fulvic acid-like, and humic acid-like
substances. Or, metabolites were not produced in the process of anaerobic fermentative hydrogen production. In comparison with the control, the pre-treatments with
Fig. 2.15 The fluorescence EEM of the DOM fractions that were extracted from the differently
pre-treated PADRs (Jia et al. 2013)
2 High-Efficient Anaerobic Fermentation Technology of Organic …
highest concentration (5.37 g/L), probably threatening the efficiency of anaerobic
digestion.
2.2.3.4 Influences of Pre-treatment on DOM
Figure 2.15 illustrates that the 3D fluorescence spectra of EEM can distinguish the
fermentative hydrogen production in the eight pre-treatments. Whereas, the intensity of fluorescence spectra and ranges of peak wavelengths exhibited remarkable
differences: it is observed that under all pre-treatments, the fluorescence peaks in
Regions I and IV were higher than those in Regions II, III, and V. This revealed that
the produced metabolites mainly involved biodegradable DOM and slightly nonbiodegradable DOM. The former included tyrosine-like and by-product-like materials and the latter consisted of tryptophan-like, fulvic acid-like, and humic acid-like
substances. Or, metabolites were not produced in the process of anaerobic fermentative hydrogen production. In comparison with the control, the pre-treatments with
Fig. 2.15 The fluorescence EEM of the DOM fractions that were extracted from the differently
pre-treated PADRs (Jia et al. 2013)