

2.2 Pre-treatment Technologies of Anaerobic Fermentation
33
2.2.3.3 Impacts of Pre-treatment on Ethanol and VFAs
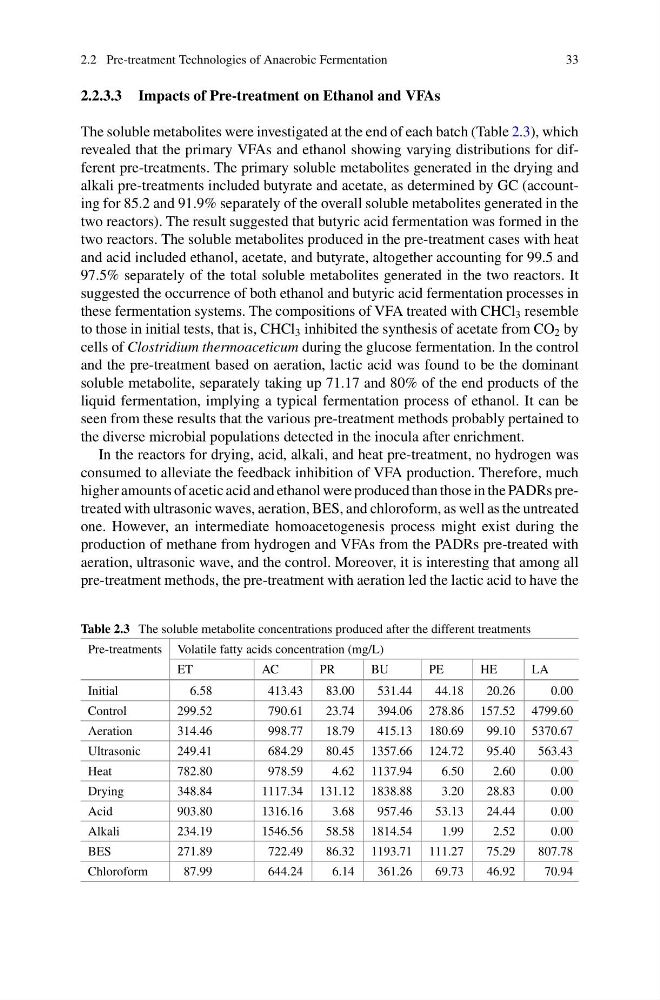
The soluble metabolites were investigated at the end of each batch (Table 2.3), which
revealed that the primary VFAs and ethanol showing varying distributions for different pre-treatments. The primary soluble metabolites generated in the drying and
alkali pre-treatments included butyrate and acetate, as determined by GC (accounting for 85.2 and 91.9% separately of the overall soluble metabolites generated in the
two reactors). The result suggested that butyric acid fermentation was formed in the
two reactors. The soluble metabolites produced in the pre-treatment cases with heat
and acid included ethanol, acetate, and butyrate, altogether accounting for 99.5 and
97.5% separately of the total soluble metabolites generated in the two reactors. It
suggested the occurrence of both ethanol and butyric acid fermentation processes in
these fermentation systems. The compositions of VFA treated with CHCl 3 resemble
to those in initial tests, that is, CHCl 3 inhibited the synthesis of acetate from CO 2 by
cells of Clostridium thermoaceticum during the glucose fermentation. In the control
and the pre-treatment based on aeration, lactic acid was found to be the dominant
soluble metabolite, separately taking up 71.17 and 80% of the end products of the
liquid fermentation, implying a typical fermentation process of ethanol. It can be
seen from these results that the various pre-treatment methods probably pertained to
the diverse microbial populations detected in the inocula after enrichment.
In the reactors for drying, acid, alkali, and heat pre-treatment, no hydrogen was
consumed to alleviate the feedback inhibition of VFA production. Therefore, much
higher amounts of acetic acid and ethanol were produced than those in the PADRs pretreated with ultrasonic waves, aeration, BES, and chloroform, as well as the untreated
one. However, an intermediate homoacetogenesis process might exist during the
production of methane from hydrogen and VFAs from the PADRs pre-treated with
aeration, ultrasonic wave, and the control. Moreover, it is interesting that among all
pre-treatment methods, the pre-treatment with aeration led the lactic acid to have the
Table 2.3 The soluble metabolite concentrations produced after the different treatments
Pre-treatments Volatile fatty acids concentration (mg/L)
ET
AC
PR
BU
PE
HE
LA
Initial
6.58
413.43
83.00
531.44
44.18
20.26
0.00
Control
299.52
790.61
23.74
394.06 278.86 157.52 4799.60
Aeration
314.46
998.77
18.79
415.13 180.69
99.10 5370.67
Ultrasonic
249.41
684.29
80.45 1357.66 124.72
95.40
563.43
Heat
782.80
978.59
4.62 1137.94
6.50
2.60
0.00
Drying
348.84
1117.34 131.12 1838.88
3.20
28.83
0.00
Acid
903.80
1316.16
3.68
957.46
53.13
24.44
0.00
Alkali
234.19
1546.56
58.58 1814.54
1.99
2.52
0.00
BES
271.89
722.49
86.32 1193.71 111.27
75.29
807.78
Chloroform
87.99
644.24
6.14
361.26
69.73
46.92
70.94
33
2.2.3.3 Impacts of Pre-treatment on Ethanol and VFAs
The soluble metabolites were investigated at the end of each batch (Table 2.3), which
revealed that the primary VFAs and ethanol showing varying distributions for different pre-treatments. The primary soluble metabolites generated in the drying and
alkali pre-treatments included butyrate and acetate, as determined by GC (accounting for 85.2 and 91.9% separately of the overall soluble metabolites generated in the
two reactors). The result suggested that butyric acid fermentation was formed in the
two reactors. The soluble metabolites produced in the pre-treatment cases with heat
and acid included ethanol, acetate, and butyrate, altogether accounting for 99.5 and
97.5% separately of the total soluble metabolites generated in the two reactors. It
suggested the occurrence of both ethanol and butyric acid fermentation processes in
these fermentation systems. The compositions of VFA treated with CHCl 3 resemble
to those in initial tests, that is, CHCl 3 inhibited the synthesis of acetate from CO 2 by
cells of Clostridium thermoaceticum during the glucose fermentation. In the control
and the pre-treatment based on aeration, lactic acid was found to be the dominant
soluble metabolite, separately taking up 71.17 and 80% of the end products of the
liquid fermentation, implying a typical fermentation process of ethanol. It can be
seen from these results that the various pre-treatment methods probably pertained to
the diverse microbial populations detected in the inocula after enrichment.
In the reactors for drying, acid, alkali, and heat pre-treatment, no hydrogen was
consumed to alleviate the feedback inhibition of VFA production. Therefore, much
higher amounts of acetic acid and ethanol were produced than those in the PADRs pretreated with ultrasonic waves, aeration, BES, and chloroform, as well as the untreated
one. However, an intermediate homoacetogenesis process might exist during the
production of methane from hydrogen and VFAs from the PADRs pre-treated with
aeration, ultrasonic wave, and the control. Moreover, it is interesting that among all
pre-treatment methods, the pre-treatment with aeration led the lactic acid to have the
Table 2.3 The soluble metabolite concentrations produced after the different treatments
Pre-treatments Volatile fatty acids concentration (mg/L)
ET
AC
PR
BU
PE
HE
LA
Initial
6.58
413.43
83.00
531.44
44.18
20.26
0.00
Control
299.52
790.61
23.74
394.06 278.86 157.52 4799.60
Aeration
314.46
998.77
18.79
415.13 180.69
99.10 5370.67
Ultrasonic
249.41
684.29
80.45 1357.66 124.72
95.40
563.43
Heat
782.80
978.59
4.62 1137.94
6.50
2.60
0.00
Drying
348.84
1117.34 131.12 1838.88
3.20
28.83
0.00
Acid
903.80
1316.16
3.68
957.46
53.13
24.44
0.00
Alkali
234.19
1546.56
58.58 1814.54
1.99
2.52
0.00
BES
271.89
722.49
86.32 1193.71 111.27
75.29
807.78
Chloroform
87.99
644.24
6.14
361.26
69.73
46.92
70.94