

CHAPTER IV
Results & Descussion
45
IV.1.6.2. Forests
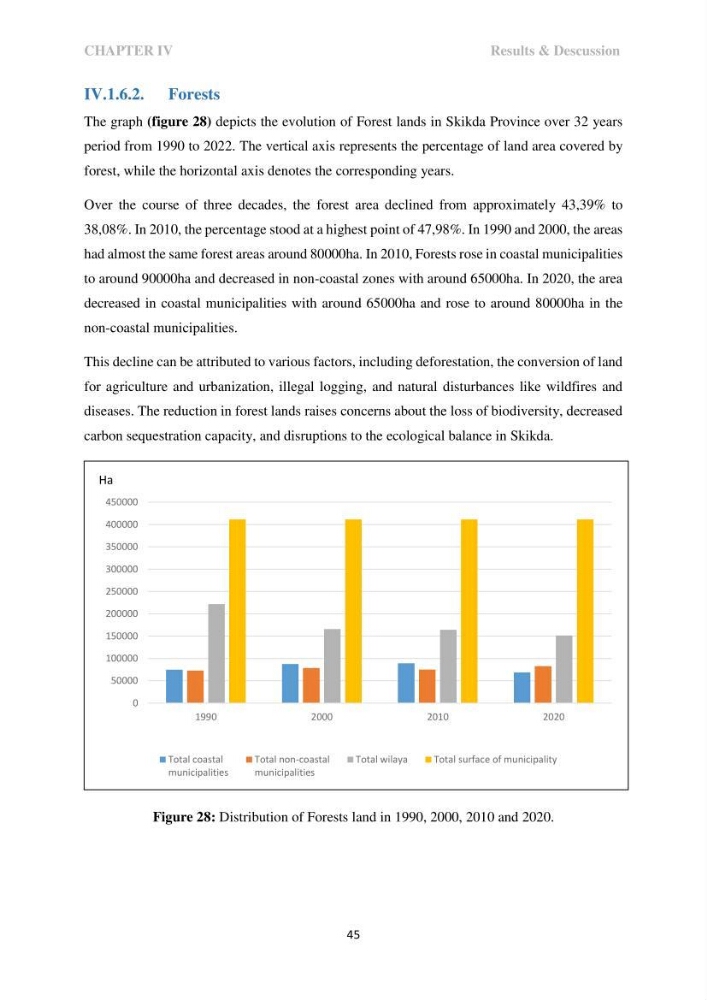
The graph (figure 28) depicts the evolution of Forest lands in Skikda Province over 32 years
period from 1990 to 2022. The vertical axis represents the percentage of land area covered by
forest, while the horizontal axis denotes the corresponding years.
Over the course of three decades, the forest area declined from approximately 43,39% to
38,08%. In 2010, the percentage stood at a highest point of 47,98%. In 1990 and 2000, the areas
had almost the same forest areas around 80000ha. In 2010, Forests rose in coastal municipalities
to around 90000ha and decreased in non-coastal zones with around 65000ha. In 2020, the area
decreased in coastal municipalities with around 65000ha and rose to around 80000ha in the
non-coastal municipalities.
This decline can be attributed to various factors, including deforestation, the conversion of land
for agriculture and urbanization, illegal logging, and natural disturbances like wildfires and
diseases. The reduction in forest lands raises concerns about the loss of biodiversity, decreased
carbon sequestration capacity, and disruptions to the ecological balance in Skikda.
Figure 28: Distribution of Forests land in 1990, 2000, 2010 and 2020.
0
50000
100000
150000
200000
250000
300000
350000
400000
450000
1990
2000
2010
2020
Total coastal
municipalities
Total non-coastal
municipalities
Total wilaya
Total surface of municipality
Ha
Results & Descussion
45
IV.1.6.2. Forests
The graph (figure 28) depicts the evolution of Forest lands in Skikda Province over 32 years
period from 1990 to 2022. The vertical axis represents the percentage of land area covered by
forest, while the horizontal axis denotes the corresponding years.
Over the course of three decades, the forest area declined from approximately 43,39% to
38,08%. In 2010, the percentage stood at a highest point of 47,98%. In 1990 and 2000, the areas
had almost the same forest areas around 80000ha. In 2010, Forests rose in coastal municipalities
to around 90000ha and decreased in non-coastal zones with around 65000ha. In 2020, the area
decreased in coastal municipalities with around 65000ha and rose to around 80000ha in the
non-coastal municipalities.
This decline can be attributed to various factors, including deforestation, the conversion of land
for agriculture and urbanization, illegal logging, and natural disturbances like wildfires and
diseases. The reduction in forest lands raises concerns about the loss of biodiversity, decreased
carbon sequestration capacity, and disruptions to the ecological balance in Skikda.
Figure 28: Distribution of Forests land in 1990, 2000, 2010 and 2020.
0
50000
100000
150000
200000
250000
300000
350000
400000
450000
1990
2000
2010
2020
Total coastal
municipalities
Total non-coastal
municipalities
Total wilaya
Total surface of municipality
Ha