

CHAPTER IV
Results & Descussion
44
IV.1.6.1.
Agriculture lands
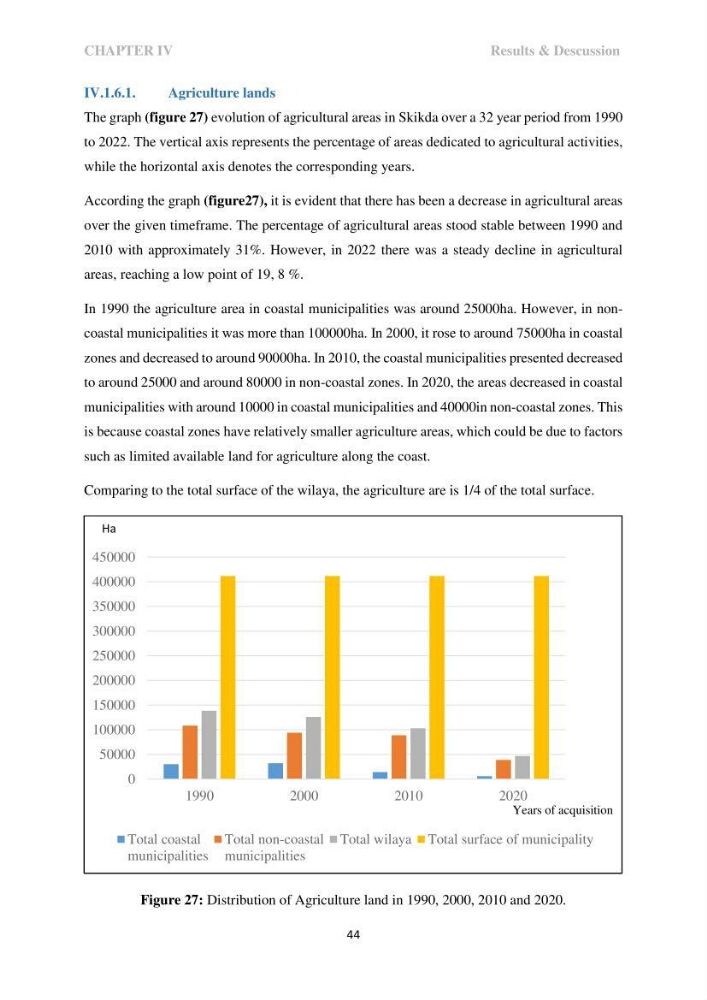
The graph (figure 27) evolution of agricultural areas in Skikda over a 32 year period from 1990
to 2022. The vertical axis represents the percentage of areas dedicated to agricultural activities,
while the horizontal axis denotes the corresponding years.
According the graph (figure27), it is evident that there has been a decrease in agricultural areas
over the given timeframe. The percentage of agricultural areas stood stable between 1990 and
2010 with approximately 31%. However, in 2022 there was a steady decline in agricultural
areas, reaching a low point of 19, 8 %.
In 1990 the agriculture area in coastal municipalities was around 25000ha. However, in noncoastal municipalities it was more than 100000ha. In 2000, it rose to around 75000ha in coastal
zones and decreased to around 90000ha. In 2010, the coastal municipalities presented decreased
to around 25000 and around 80000 in non-coastal zones. In 2020, the areas decreased in coastal
municipalities with around 10000 in coastal municipalities and 40000in non-coastal zones. This
is because coastal zones have relatively smaller agriculture areas, which could be due to factors
such as limited available land for agriculture along the coast.
Comparing to the total surface of the wilaya, the agriculture are is 1/4 of the total surface.
Figure 27: Distribution of Agriculture land in 1990, 2000, 2010 and 2020.
0
50000
100000
150000
200000
250000
300000
350000
400000
450000
1990
2000
2010
2020
Total coastal
municipalities
Total non-coastal
municipalities
Total wilaya Total surface of municipality
Ha
Years of acquisition
Results & Descussion
44
IV.1.6.1.
Agriculture lands
The graph (figure 27) evolution of agricultural areas in Skikda over a 32 year period from 1990
to 2022. The vertical axis represents the percentage of areas dedicated to agricultural activities,
while the horizontal axis denotes the corresponding years.
According the graph (figure27), it is evident that there has been a decrease in agricultural areas
over the given timeframe. The percentage of agricultural areas stood stable between 1990 and
2010 with approximately 31%. However, in 2022 there was a steady decline in agricultural
areas, reaching a low point of 19, 8 %.
In 1990 the agriculture area in coastal municipalities was around 25000ha. However, in noncoastal municipalities it was more than 100000ha. In 2000, it rose to around 75000ha in coastal
zones and decreased to around 90000ha. In 2010, the coastal municipalities presented decreased
to around 25000 and around 80000 in non-coastal zones. In 2020, the areas decreased in coastal
municipalities with around 10000 in coastal municipalities and 40000in non-coastal zones. This
is because coastal zones have relatively smaller agriculture areas, which could be due to factors
such as limited available land for agriculture along the coast.
Comparing to the total surface of the wilaya, the agriculture are is 1/4 of the total surface.
Figure 27: Distribution of Agriculture land in 1990, 2000, 2010 and 2020.
0
50000
100000
150000
200000
250000
300000
350000
400000
450000
1990
2000
2010
2020
Total coastal
municipalities
Total non-coastal
municipalities
Total wilaya Total surface of municipality
Ha
Years of acquisition