

72
port during the landing, which could be challenging. As a matter of fact, fisheries landing
statistics describe species by their common names or even those used locally. This annotation
makes the selection of the corresponding trophic level complex. Indeed, this is the case for
several species, such as Sarpa salpa (saupe, chelba, tchelba), Dasyatis pastinaca (tchouch,
pastenague), and Trachurus trachurus (Chinchard, saurel). In addition, other species are
reported under the corresponding category, such as mollusks, small pelagic, and demersal
fish. In this case, selecting an average trophic level by category could bias the PPR, thus the
EF_fish results.
The EF_c, expresses the required land to sequester CO2 emissions generated by energy (fuel
combustion). This metric is associated with the combustion of gasoil during fishing for three
main métiers categories: trawlers, sardines, and small-scale vessels. The latter is eight times
higher in Algiers compared to Tipaza. Trawlers consume the highest amount of fuel.
Moreover, a detailed study highlighted that sardine vessels use the least fuel quantity per
estimated production compared to trawlers and small-scale vessels, representing 67% and
23%, respectively. This could be related to the significant tonnage of pelagic fishes that sardine
vessels land since small pelagic fishes represent more than 80% of Algeria's fisheries. The study
context could also explain these findings. Indeed, thus CO2 emissions estimates are based on
information provided by fishers, such as fishing trips number per month for each type of
métier and gasoline consumption during fishing trips.
Moreover, the emissions resulting from fishing trips represent about 90% of the total
emissions of the fishing sector. Consequently, the management bodies (e.g., DPRH, SGPP) and
the fishers should pay further attention to this component.
However, other parameters have not been considered, particularly the embodied energy
exploited for shipbuilding, aquaculture's fish meal, and fisheries products processing.
The EF_built in Algiers is greater mainly due to the greater extent of port structures in Algiers.
4.2.2. Food sector
Detailed EF by crops and livestock products, is detailed in Appendix 7 for both wilayas. This
calculation is based on conversion figures (yield factor, equivalence factor) specific to each
product and each category of land (cropland and grazing land). Moreover, the EF equivalent
to livestock product is estimated according to the NFA basis for grazing land footprint
(Appendix 2).
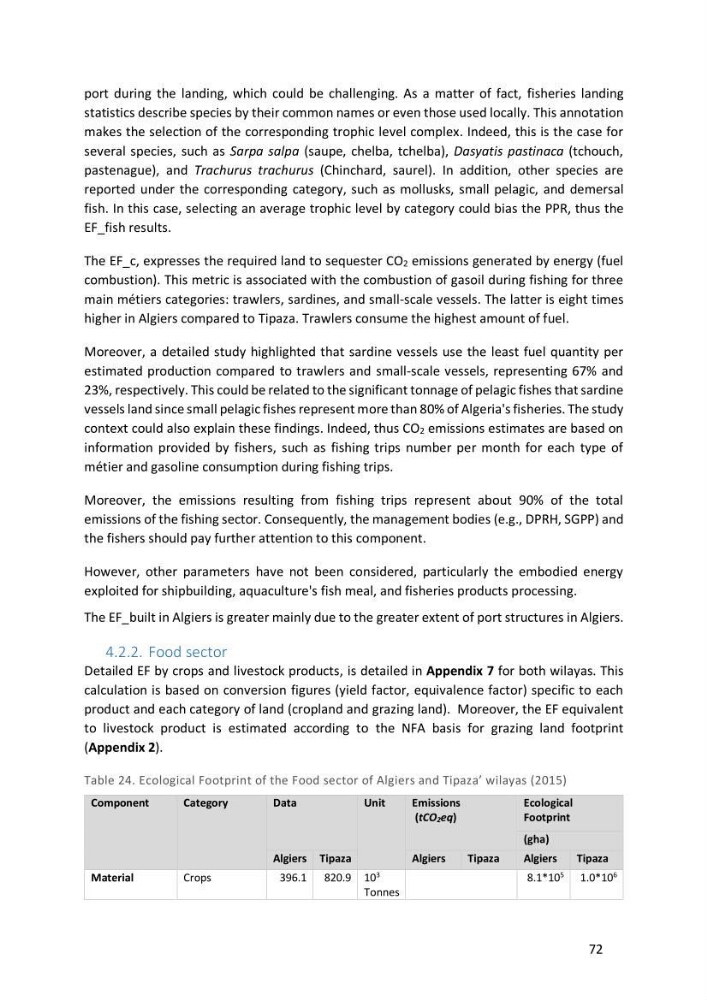
Table 24. Ecological Footprint of the Food sector of Algiers and Tipaza’ wilayas (2015)
Component
Category
Data
Unit
Emissions
(tCO2eq)
Ecological
Footprint
(gha)
Algiers Tipaza
Algiers
Tipaza
Algiers
Tipaza
Material
Crops
396.1 820.9 10
3
Tonnes
8.1*10
5
1.0*10
6
port during the landing, which could be challenging. As a matter of fact, fisheries landing
statistics describe species by their common names or even those used locally. This annotation
makes the selection of the corresponding trophic level complex. Indeed, this is the case for
several species, such as Sarpa salpa (saupe, chelba, tchelba), Dasyatis pastinaca (tchouch,
pastenague), and Trachurus trachurus (Chinchard, saurel). In addition, other species are
reported under the corresponding category, such as mollusks, small pelagic, and demersal
fish. In this case, selecting an average trophic level by category could bias the PPR, thus the
EF_fish results.
The EF_c, expresses the required land to sequester CO2 emissions generated by energy (fuel
combustion). This metric is associated with the combustion of gasoil during fishing for three
main métiers categories: trawlers, sardines, and small-scale vessels. The latter is eight times
higher in Algiers compared to Tipaza. Trawlers consume the highest amount of fuel.
Moreover, a detailed study highlighted that sardine vessels use the least fuel quantity per
estimated production compared to trawlers and small-scale vessels, representing 67% and
23%, respectively. This could be related to the significant tonnage of pelagic fishes that sardine
vessels land since small pelagic fishes represent more than 80% of Algeria's fisheries. The study
context could also explain these findings. Indeed, thus CO2 emissions estimates are based on
information provided by fishers, such as fishing trips number per month for each type of
métier and gasoline consumption during fishing trips.
Moreover, the emissions resulting from fishing trips represent about 90% of the total
emissions of the fishing sector. Consequently, the management bodies (e.g., DPRH, SGPP) and
the fishers should pay further attention to this component.
However, other parameters have not been considered, particularly the embodied energy
exploited for shipbuilding, aquaculture's fish meal, and fisheries products processing.
The EF_built in Algiers is greater mainly due to the greater extent of port structures in Algiers.
4.2.2. Food sector
Detailed EF by crops and livestock products, is detailed in Appendix 7 for both wilayas. This
calculation is based on conversion figures (yield factor, equivalence factor) specific to each
product and each category of land (cropland and grazing land). Moreover, the EF equivalent
to livestock product is estimated according to the NFA basis for grazing land footprint
(Appendix 2).
Table 24. Ecological Footprint of the Food sector of Algiers and Tipaza’ wilayas (2015)
Component
Category
Data
Unit
Emissions
(tCO2eq)
Ecological
Footprint
(gha)
Algiers Tipaza
Algiers
Tipaza
Algiers
Tipaza
Material
Crops
396.1 820.9 10
3
Tonnes
8.1*10
5
1.0*10
6