

58
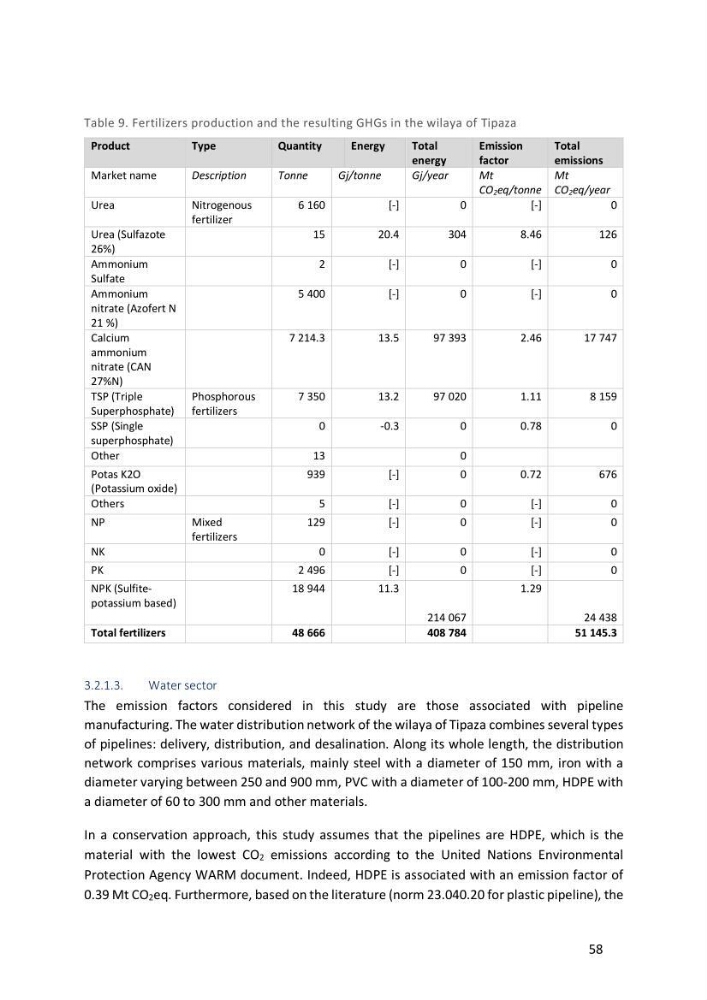
Table 9. Fertilizers production and the resulting GHGs in the wilaya of Tipaza
Product
Type
Quantity
Energy
Total
energy
Emission
factor
Total
emissions
Market name
Description
Tonne
Gj/tonne
Gj/year
Mt
CO2eq/tonne
Mt
CO2eq/year
Urea
Nitrogenous
fertilizer
6 160
[-]
0
[-]
0
Urea (Sulfazote
26%)
15
20.4
304
8.46
126
Ammonium
Sulfate
2
[-]
0
[-]
0
Ammonium
nitrate (Azofert N
21 %)
5 400
[-]
0
[-]
0
Calcium
ammonium
nitrate (CAN
27%N)
7 214.3
13.5
97 393
2.46
17 747
TSP (Triple
Superphosphate)
Phosphorous
fertilizers
7 350
13.2
97 020
1.11
8 159
SSP (Single
superphosphate)
0
-0.3
0
0.78
0
Other
13
0
Potas K2O
(Potassium oxide)
939
[-]
0
0.72
676
Others
5
[-]
0
[-]
0
NP
Mixed
fertilizers
129
[-]
0
[-]
0
NK
0
[-]
0
[-]
0
PK
2 496
[-]
0
[-]
0
NPK (Sulfitepotassium based)
18 944
11.3
214 067
1.29
24 438
Total fertilizers
48 666
408 784
51 145.3
3.2.1.3.
Water sector
The emission factors considered in this study are those associated with pipeline
manufacturing. The water distribution network of the wilaya of Tipaza combines several types
of pipelines: delivery, distribution, and desalination. Along its whole length, the distribution
network comprises various materials, mainly steel with a diameter of 150 mm, iron with a
diameter varying between 250 and 900 mm, PVC with a diameter of 100-200 mm, HDPE with
a diameter of 60 to 300 mm and other materials.
In a conservation approach, this study assumes that the pipelines are HDPE, which is the
material with the lowest CO2 emissions according to the United Nations Environmental
Protection Agency WARM document. Indeed, HDPE is associated with an emission factor of
0.39 Mt CO2eq. Furthermore, based on the literature (norm 23.040.20 for plastic pipeline), the
Table 9. Fertilizers production and the resulting GHGs in the wilaya of Tipaza
Product
Type
Quantity
Energy
Total
energy
Emission
factor
Total
emissions
Market name
Description
Tonne
Gj/tonne
Gj/year
Mt
CO2eq/tonne
Mt
CO2eq/year
Urea
Nitrogenous
fertilizer
6 160
[-]
0
[-]
0
Urea (Sulfazote
26%)
15
20.4
304
8.46
126
Ammonium
Sulfate
2
[-]
0
[-]
0
Ammonium
nitrate (Azofert N
21 %)
5 400
[-]
0
[-]
0
Calcium
ammonium
nitrate (CAN
27%N)
7 214.3
13.5
97 393
2.46
17 747
TSP (Triple
Superphosphate)
Phosphorous
fertilizers
7 350
13.2
97 020
1.11
8 159
SSP (Single
superphosphate)
0
-0.3
0
0.78
0
Other
13
0
Potas K2O
(Potassium oxide)
939
[-]
0
0.72
676
Others
5
[-]
0
[-]
0
NP
Mixed
fertilizers
129
[-]
0
[-]
0
NK
0
[-]
0
[-]
0
PK
2 496
[-]
0
[-]
0
NPK (Sulfitepotassium based)
18 944
11.3
214 067
1.29
24 438
Total fertilizers
48 666
408 784
51 145.3
3.2.1.3.
Water sector
The emission factors considered in this study are those associated with pipeline
manufacturing. The water distribution network of the wilaya of Tipaza combines several types
of pipelines: delivery, distribution, and desalination. Along its whole length, the distribution
network comprises various materials, mainly steel with a diameter of 150 mm, iron with a
diameter varying between 250 and 900 mm, PVC with a diameter of 100-200 mm, HDPE with
a diameter of 60 to 300 mm and other materials.
In a conservation approach, this study assumes that the pipelines are HDPE, which is the
material with the lowest CO2 emissions according to the United Nations Environmental
Protection Agency WARM document. Indeed, HDPE is associated with an emission factor of
0.39 Mt CO2eq. Furthermore, based on the literature (norm 23.040.20 for plastic pipeline), the