

29
which is converted to equivalent primary production calculated based on trophic levels of the
species caught (Ewing et al., 2009, 2010; GFN, 2018). The NFAs provide estimates of primary
production requirements for 1 439 marine species and over 268 freshwater species (Lin et al.,
2016).
1.3.3.3.5.
Built-up land
According to the GFN, built-up surfaces are those covered by human infrastructure, such as
roads, houses, industrial structures, and hydroelectric power reservoirs (Boev et al., 2016).
According to the EF approach, this refers to the occupation of fertile bioproductive lands that
have been physically altered by human activities (Lin et al., 2016). Therefore, associated with
a loss of terrestrial biocapacity (Wernert, 2007).
1.3.4. Related and similar approaches
The Agenda 2030 sustainable development goals account for reducing carbon emissions,
reshaping economic growth in a more environmentally responsible aspect, natural capital
conservation, and development of renewable energy use. However, to achieve these
objectives it is necessary to assess the current state of the resources. Accordingly, several
indicators have been developed aiming mostly at assessing both human economic growth and
the natural capital on which it relies. These two components are considered by the EF as it
accounts for the required area to meet resource consumption needs and absorb the wastes
generated by a human population. Comparable estimate are provided by other indicators such
as human appropriation of net primary production (HANPP), environmentally weighted
material consumption (EMC), land and Ecosystem accounts (LEAC), and economics of
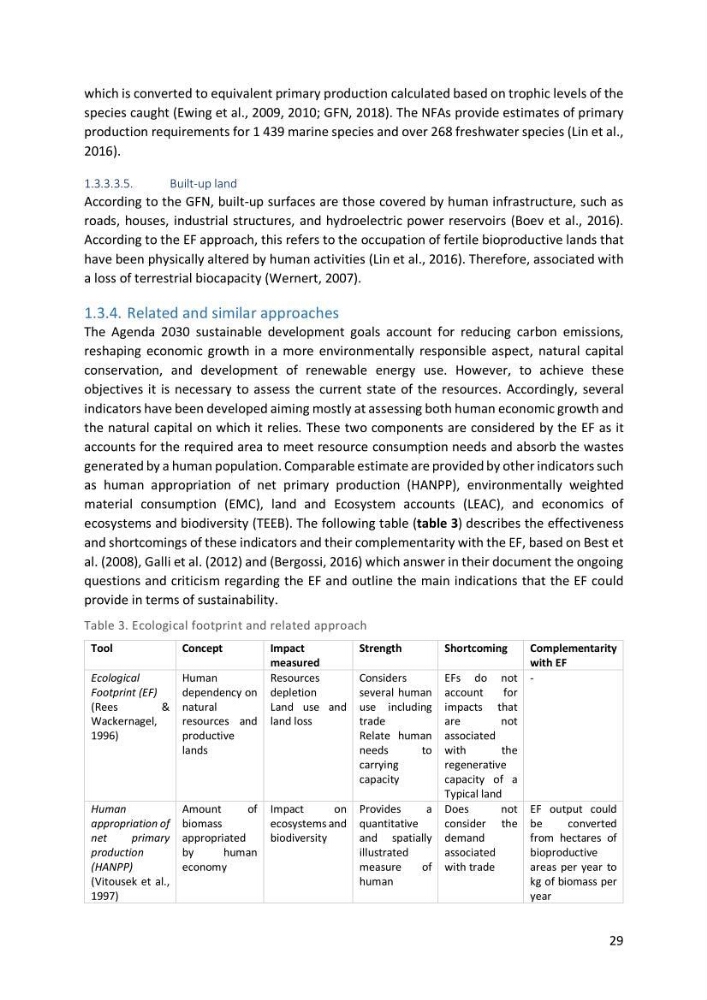
ecosystems and biodiversity (TEEB). The following table (table 3) describes the effectiveness
and shortcomings of these indicators and their complementarity with the EF, based on Best et
al. (2008), Galli et al. (2012) and (Bergossi, 2016) which answer in their document the ongoing
questions and criticism regarding the EF and outline the main indications that the EF could
provide in terms of sustainability.
Table 3. Ecological footprint and related approach
Tool
Concept
Impact
measured
Strength
Shortcoming
Complementarity
with EF
Ecological
Footprint (EF)
(Rees
&
Wackernagel,
1996)
Human
dependency on
natural
resources and
productive
lands
Resources
depletion
Land use and
land loss
Considers
several human
use including
trade
Relate human
needs
to
carrying
capacity
EFs do not
account
for
impacts that
are
not
associated
with
the
regenerative
capacity of a
Typical land
-
Human
appropriation of
net
primary
production
(HANPP)
(Vitousek et al.,
1997)
Amount
of
biomass
appropriated
by
human
economy
Impact
on
ecosystems and
biodiversity
Provides
a
quantitative
and spatially
illustrated
measure
of
human
Does
not
consider the
demand
associated
with trade
EF output could
be
converted
from hectares of
bioproductive
areas per year to
kg of biomass per
year
which is converted to equivalent primary production calculated based on trophic levels of the
species caught (Ewing et al., 2009, 2010; GFN, 2018). The NFAs provide estimates of primary
production requirements for 1 439 marine species and over 268 freshwater species (Lin et al.,
2016).
1.3.3.3.5.
Built-up land
According to the GFN, built-up surfaces are those covered by human infrastructure, such as
roads, houses, industrial structures, and hydroelectric power reservoirs (Boev et al., 2016).
According to the EF approach, this refers to the occupation of fertile bioproductive lands that
have been physically altered by human activities (Lin et al., 2016). Therefore, associated with
a loss of terrestrial biocapacity (Wernert, 2007).
1.3.4. Related and similar approaches
The Agenda 2030 sustainable development goals account for reducing carbon emissions,
reshaping economic growth in a more environmentally responsible aspect, natural capital
conservation, and development of renewable energy use. However, to achieve these
objectives it is necessary to assess the current state of the resources. Accordingly, several
indicators have been developed aiming mostly at assessing both human economic growth and
the natural capital on which it relies. These two components are considered by the EF as it
accounts for the required area to meet resource consumption needs and absorb the wastes
generated by a human population. Comparable estimate are provided by other indicators such
as human appropriation of net primary production (HANPP), environmentally weighted
material consumption (EMC), land and Ecosystem accounts (LEAC), and economics of
ecosystems and biodiversity (TEEB). The following table (table 3) describes the effectiveness
and shortcomings of these indicators and their complementarity with the EF, based on Best et
al. (2008), Galli et al. (2012) and (Bergossi, 2016) which answer in their document the ongoing
questions and criticism regarding the EF and outline the main indications that the EF could
provide in terms of sustainability.
Table 3. Ecological footprint and related approach
Tool
Concept
Impact
measured
Strength
Shortcoming
Complementarity
with EF
Ecological
Footprint (EF)
(Rees
&
Wackernagel,
1996)
Human
dependency on
natural
resources and
productive
lands
Resources
depletion
Land use and
land loss
Considers
several human
use including
trade
Relate human
needs
to
carrying
capacity
EFs do not
account
for
impacts that
are
not
associated
with
the
regenerative
capacity of a
Typical land
-
Human
appropriation of
net
primary
production
(HANPP)
(Vitousek et al.,
1997)
Amount
of
biomass
appropriated
by
human
economy
Impact
on
ecosystems and
biodiversity
Provides
a
quantitative
and spatially
illustrated
measure
of
human
Does
not
consider the
demand
associated
with trade
EF output could
be
converted
from hectares of
bioproductive
areas per year to
kg of biomass per
year