

145
Appendix 6. Estimated Ecological Footprint of Fishing by species
The calculation of the fishing EF is based on the estimate of the biomass needed to sustain
fisheries catches. Therefore, for each species the EF considers the trophic level of its prey
species (TL-1), the landing statistics each species, and its specific yield factor according to the
following equation:
Equation 6. Fishing grounds EF's equation
í µí°¸í µí°¹_í µí±í µí±í µí± ℎí µí±í µí±í µí±(í µí±) =
99L:
9M:
Equation 6
PAi: Average annual marine biomass available at the continental shelf level (this is the
equivalent of the global average yield for agricultural products, or derived agri-food products
(tC.ha
-1
.an
-1
)
PPRi is the specific requirement for species i, known as the required primary production (tC.ha
-
1
). The PPR is given by the following equation:
Equation 7. Primary production required equation
í µí±í µí±í µí± í µí± = P
Q
R
∗
9:∗TL
(UV) (WXYZ) [ ∗ í µí°¸í µí±í µí°¹
Equation 7
Pi: Landing of the species i (tonnes);
DR: discard ratio 1.27 which stipulates that 0.27 tonnes of fish are caught accidentally for
every 1 tonne of targeted fish;
TE: Energy transfer coefficient between prey species and its predator, estimated at 10%;
TL: Trophic level specific to each species;
EQF: Equivalence factor specific to the fishing grounds category 0.37 gha/ha;
1/9 is the carbon content of fish biomass, per wet unit weight.
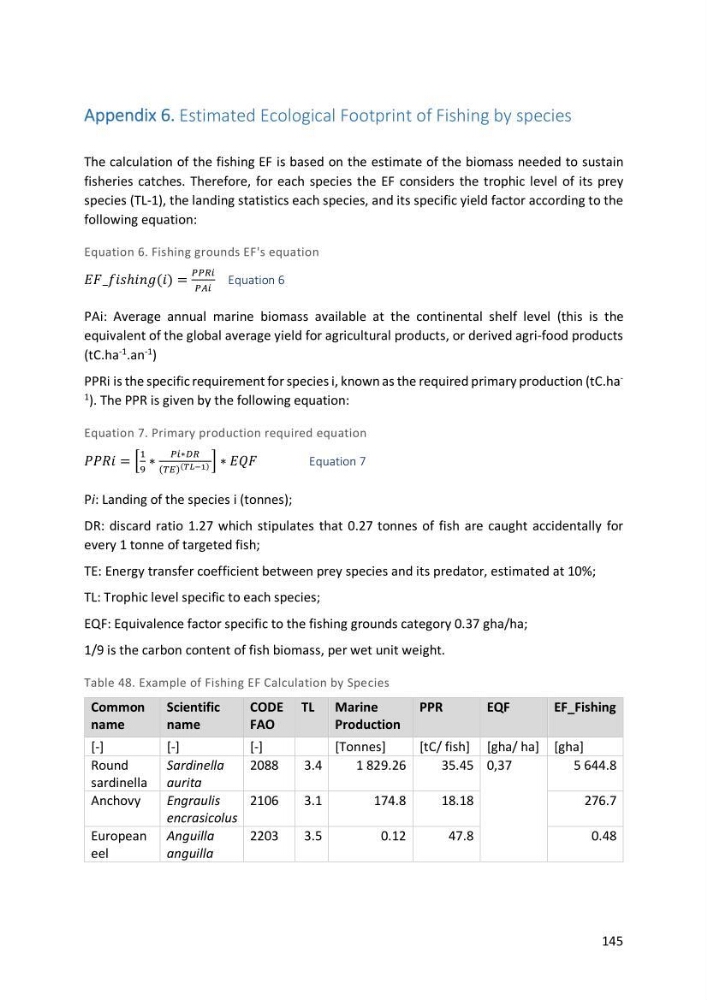
Table 48. Example of Fishing EF Calculation by Species
Common
name
Scientific
name
CODE
FAO
TL Marine
Production
PPR
EQF
EF_Fishing
[-]
[-]
[-]
[Tonnes]
[tC/ fish] [gha/ ha] [gha]
Round
sardinella
Sardinella
aurita
2088
3.4
1 829.26
35.45 0,37
5 644.8
Anchovy
Engraulis
encrasicolus
2106
3.1
174.8
18.18
276.7
European
eel
Anguilla
anguilla
2203
3.5
0.12
47.8
0.48
Appendix 6. Estimated Ecological Footprint of Fishing by species
The calculation of the fishing EF is based on the estimate of the biomass needed to sustain
fisheries catches. Therefore, for each species the EF considers the trophic level of its prey
species (TL-1), the landing statistics each species, and its specific yield factor according to the
following equation:
Equation 6. Fishing grounds EF's equation
í µí°¸í µí°¹_í µí±í µí±í µí± ℎí µí±í µí±í µí±(í µí±) =
99L:
9M:
Equation 6
PAi: Average annual marine biomass available at the continental shelf level (this is the
equivalent of the global average yield for agricultural products, or derived agri-food products
(tC.ha
-1
.an
-1
)
PPRi is the specific requirement for species i, known as the required primary production (tC.ha
-
1
). The PPR is given by the following equation:
Equation 7. Primary production required equation
í µí±í µí±í µí± í µí± = P
Q
R
∗
9:∗TL
(UV) (WXYZ) [ ∗ í µí°¸í µí±í µí°¹
Equation 7
Pi: Landing of the species i (tonnes);
DR: discard ratio 1.27 which stipulates that 0.27 tonnes of fish are caught accidentally for
every 1 tonne of targeted fish;
TE: Energy transfer coefficient between prey species and its predator, estimated at 10%;
TL: Trophic level specific to each species;
EQF: Equivalence factor specific to the fishing grounds category 0.37 gha/ha;
1/9 is the carbon content of fish biomass, per wet unit weight.
Table 48. Example of Fishing EF Calculation by Species
Common
name
Scientific
name
CODE
FAO
TL Marine
Production
PPR
EQF
EF_Fishing
[-]
[-]
[-]
[Tonnes]
[tC/ fish] [gha/ ha] [gha]
Round
sardinella
Sardinella
aurita
2088
3.4
1 829.26
35.45 0,37
5 644.8
Anchovy
Engraulis
encrasicolus
2106
3.1
174.8
18.18
276.7
European
eel
Anguilla
anguilla
2203
3.5
0.12
47.8
0.48