

52
Chapter 2
When a function z is maximized several cards or variables are select so
probability of
P(z) > P(zmax)
and this is a card selection of variables separately
P(z) > P(zmax) _> P(xlx2x3x4... Xn)
from Example 2.1
P(xl x2x3x4 . . . xn) = P(xI )P(x2)P(x3)P(x4) .
0.01
P(Xl): P(Xi)So Eq. (2.29)
(2.27)
(2.28)
(2.29)
(2.30)
P(xl xzx3 x4... x,)
(2.31)
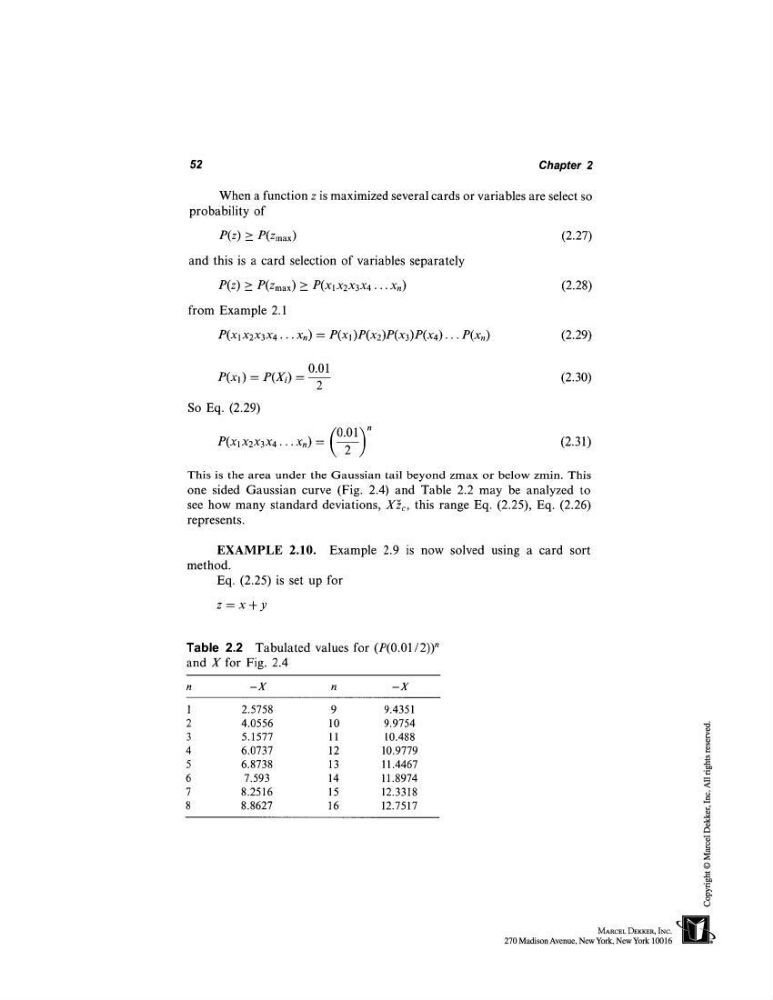
This is the area under the Gaussian tail beyond zmax or below zmin. This
one sided Gaussian curve (Fig. 2.4) and Table 2.2 may be analyzed
see how many standard deviations, X~c, this range Eq. (2.25), Eq. (2.26)
represents.
EXAMPLE 2.10. Example 2.9 is now solved using a card sort
method.
Eq. (2.25) is set up for
z=x+y
Table 2.2 Tabulated values for (P(0.01/2))
n
and X for Fig. 2.4
n
-X
n
-X
1
2.5758
9
9.4351
2
4.0556
10
9.9754
3
5.1577
11
10.488
4
6.0737
12
10.9779
5
6.8738
13
11.4467
6
7.593
14
11.8974
7
8.2516
15
12.3318
8
8.8627
16
12.7517
Chapter 2
When a function z is maximized several cards or variables are select so
probability of
P(z) > P(zmax)
and this is a card selection of variables separately
P(z) > P(zmax) _> P(xlx2x3x4... Xn)
from Example 2.1
P(xl x2x3x4 . . . xn) = P(xI )P(x2)P(x3)P(x4) .
0.01
P(Xl): P(Xi)So Eq. (2.29)
(2.27)
(2.28)
(2.29)
(2.30)
P(xl xzx3 x4... x,)
(2.31)
This is the area under the Gaussian tail beyond zmax or below zmin. This
one sided Gaussian curve (Fig. 2.4) and Table 2.2 may be analyzed
see how many standard deviations, X~c, this range Eq. (2.25), Eq. (2.26)
represents.
EXAMPLE 2.10. Example 2.9 is now solved using a card sort
method.
Eq. (2.25) is set up for
z=x+y
Table 2.2 Tabulated values for (P(0.01/2))
n
and X for Fig. 2.4
n
-X
n
-X
1
2.5758
9
9.4351
2
4.0556
10
9.9754
3
5.1577
11
10.488
4
6.0737
12
10.9779
5
6.8738
13
11.4467
6
7.593
14
11.8974
7
8.2516
15
12.3318
8
8.8627
16
12.7517