

Data Reduction
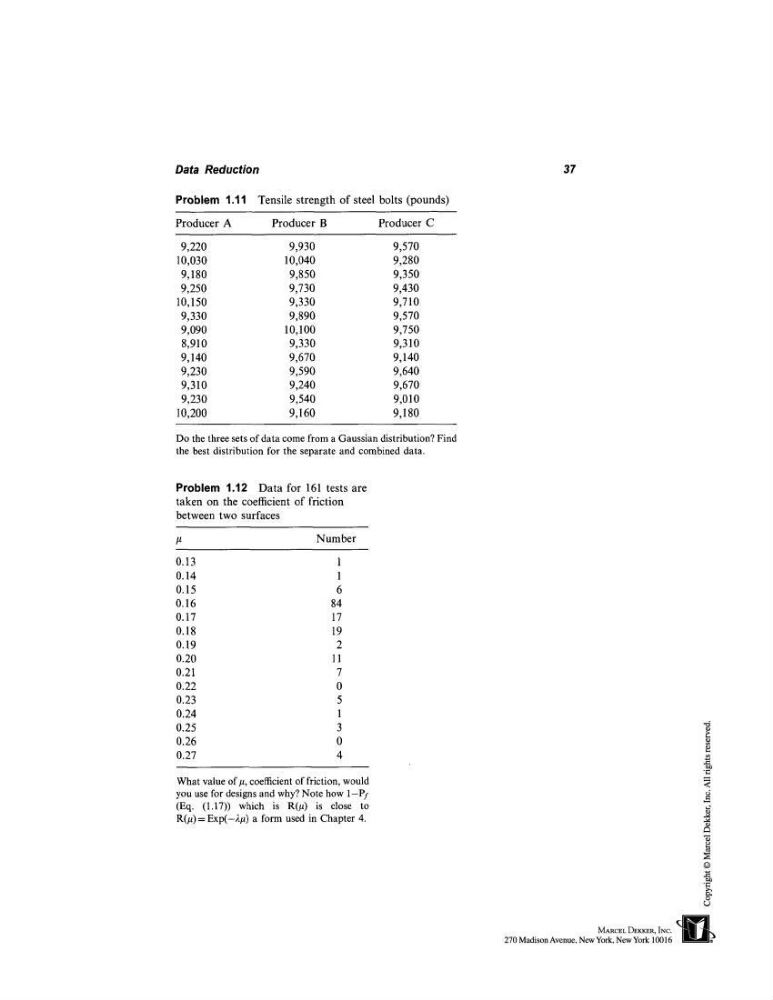
Problem 1.11 Tensile strength of steel bolts (pounds)
Producer A
Producer B
Producer C
9,220
9,930
9,570
10,030
10,040
9,280
9,180
9,850
9,350
9,250
9,730
9,430
10,150
9,330
9,710
9,330
9,890
9,570
9,090
10,100
9,750
8,910
9,330
9,310
9,140
9,670
9,140
9,230
9,590
9,640
9,310
9,240
9,670
9,230
9,540
9,010
10,200
9,160
9,180
Do the three sets of data come from a Gaussian distribution? Find
the best distribution for the separate and combined data.
Problem 1.12 Data for 161 tests are
taken on the coefficient of friction
between two surfaces
Number
0.13
1
0.14
1
0.15
6
0.16
84
0.17
17
0.18
19
0.19
2
0.20
11
0.21
7
0.22
0
0.23
5
0.24
1
0.25
3
0.26
0
0.27
4
What value of/~, coefficient of friction, would
you use for designs and why? Note how 1-PT
(Eq. (1.17)) which is R(g) is close
R(#) = Exp(-2#) a form used in Chapter
37
Problem 1.11 Tensile strength of steel bolts (pounds)
Producer A
Producer B
Producer C
9,220
9,930
9,570
10,030
10,040
9,280
9,180
9,850
9,350
9,250
9,730
9,430
10,150
9,330
9,710
9,330
9,890
9,570
9,090
10,100
9,750
8,910
9,330
9,310
9,140
9,670
9,140
9,230
9,590
9,640
9,310
9,240
9,670
9,230
9,540
9,010
10,200
9,160
9,180
Do the three sets of data come from a Gaussian distribution? Find
the best distribution for the separate and combined data.
Problem 1.12 Data for 161 tests are
taken on the coefficient of friction
between two surfaces
Number
0.13
1
0.14
1
0.15
6
0.16
84
0.17
17
0.18
19
0.19
2
0.20
11
0.21
7
0.22
0
0.23
5
0.24
1
0.25
3
0.26
0
0.27
4
What value of/~, coefficient of friction, would
you use for designs and why? Note how 1-PT
(Eq. (1.17)) which is R(g) is close
R(#) = Exp(-2#) a form used in Chapter
37