

Reliability
201
wearing out. Equation (4.2) describes the two-parameter Gaussian model
1 ~
1 (t-~ 1~)2]d
t
(4.18)
R(t)-~/~
J expI-~\
3
t
where/~ is the mean life of ~ is the standard deviation, a measure of the
dispersion of reliability values about the mean life. ~ and ~ are computed
from a limited sample of experimental data. The discrete events (failures)
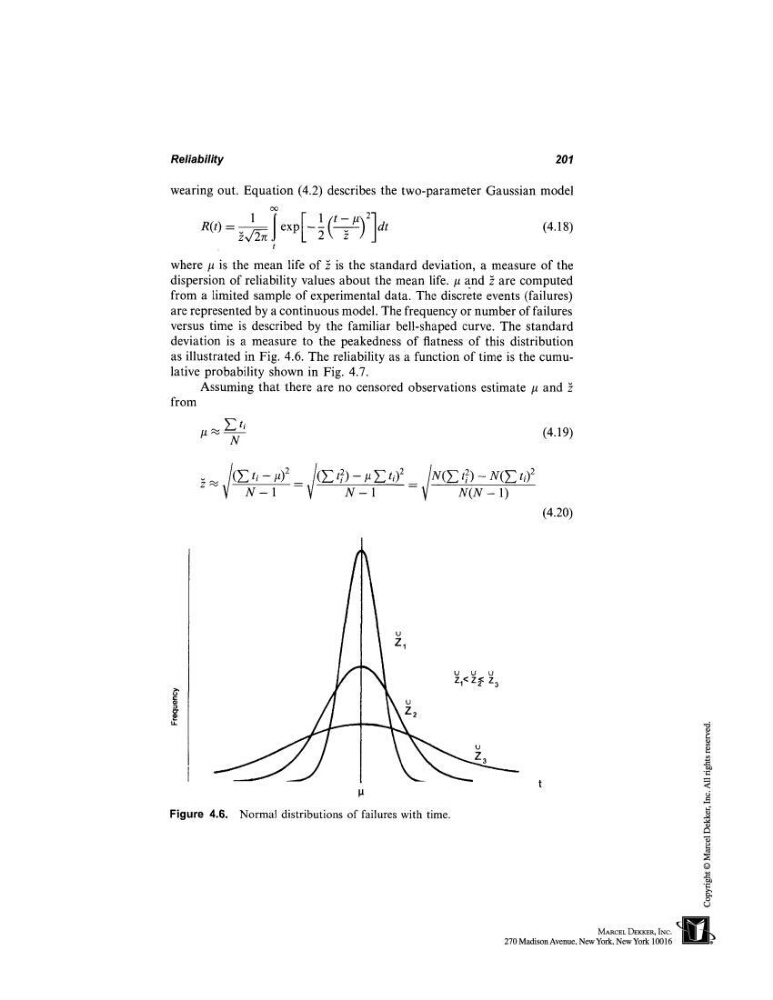
are represented by a continuous model. The frequency or number of failures
versus time is described by the familiar bell-shaped curve. The standard
deviation is a measure to the peakedness of flatness of this distribution
as illustrated in Fig. 4.6. The reliability as a function of time is the cumulative probability shown in Fig. 4.7.
Assuming that there are no censored observations estimate /~ and }
from
# ~ -(4.19)
N
~--i = W N(N - 1)
(4.20)
Figure 4.6.
U
ZI<
Z2< Z3
Normal distributions of failures with time.
201
wearing out. Equation (4.2) describes the two-parameter Gaussian model
1 ~
1 (t-~ 1~)2]d
t
(4.18)
R(t)-~/~
J expI-~\
3
t
where/~ is the mean life of ~ is the standard deviation, a measure of the
dispersion of reliability values about the mean life. ~ and ~ are computed
from a limited sample of experimental data. The discrete events (failures)
are represented by a continuous model. The frequency or number of failures
versus time is described by the familiar bell-shaped curve. The standard
deviation is a measure to the peakedness of flatness of this distribution
as illustrated in Fig. 4.6. The reliability as a function of time is the cumulative probability shown in Fig. 4.7.
Assuming that there are no censored observations estimate /~ and }
from
# ~ -(4.19)
N
~--i = W N(N - 1)
(4.20)
Figure 4.6.
U
ZI<
Z2< Z3
Normal distributions of failures with time.