

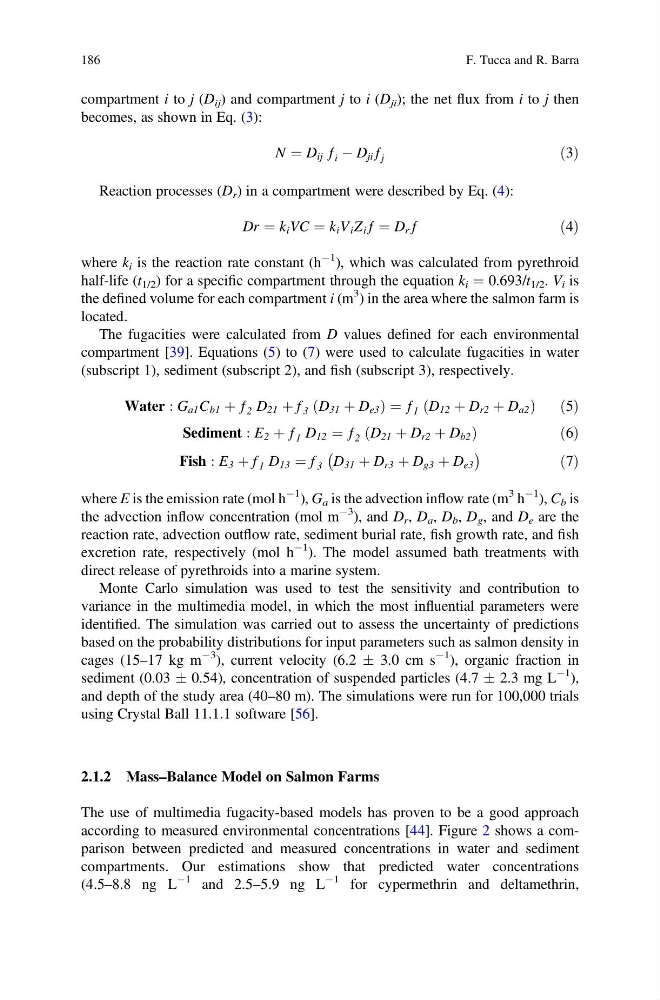
compartment i to j (D ij ) and compartment j to i (D ji ); the net flux from i to j then
becomes, as shown in Eq. (3):
N ¼ D ij ƒ i À D ji ƒ j
ð3Þ
Reaction processes (D r ) in a compartment were described by Eq. (4):
Dr ¼ k i VC ¼ k i V i Z i ƒ ¼ D r ƒ
ð4Þ
where k i is the reaction rate constant (h
À1 ), which was calculated from pyrethroid
half-life (t 1/2 ) for a specific compartment through the equation k i ¼ 0.693/t 1/2 . V i is
the defined volume for each compartment i (m
3 ) in the area where the salmon farm is
located.
The fugacities were calculated from D values defined for each environmental
compartment [39]. Equations (5) to (7) were used to calculate fugacities in water
(subscript 1), sediment (subscript 2), and fish (subscript 3), respectively.
Water : G a1 C b1 þ ƒ 2 D 21 þ f 3 D 31 þ D e3
ð
Þ¼ƒ 1 D 12 þ D r2 þ D a2
ð
Þ
ð 5Þ
Sediment : E 2 þ ƒ 1 D 12 ¼ ƒ 2 D 21 þ D r2 þ D b2
ð
Þ
ð 6Þ
Fish : E 3 þ f 1 D 13 ¼ f 3 D 31 þ D r3 þ D g3 þ D e3
À
Á
ð7Þ
where E is the emission rate (mol h
À1 ), G a is the advection inflow rate (m
3 h
À1 ), C b is
the advection inflow concentration (mol m
À3 ), and D r , D a , D b , D g , and D e are the
reaction rate, advection outflow rate, sediment burial rate, fish growth rate, and fish
excretion rate, respectively (mol h
À1 ). The model assumed bath treatments with
direct release of pyrethroids into a marine system.
Monte Carlo simulation was used to test the sensitivity and contribution to
variance in the multimedia model, in which the most influential parameters were
identified. The simulation was carried out to assess the uncertainty of predictions
based on the probability distributions for input parameters such as salmon density in
cages (15–17 kg m
À3
), current velocity (6.2 Æ 3.0 cm s
À1 ), organic fraction in
sediment (0.03 Æ 0.54), concentration of suspended particles (4.7 Æ 2.3 mg L
À1 ),
and depth of the study area (40–80 m). The simulations were run for 100,000 trials
using Crystal Ball 11.1.1 software [56].
2.1.2 Mass–Balance Model on Salmon Farms
The use of multimedia fugacity-based models has proven to be a good approach
according to measured environmental concentrations [44]. Figure 2 shows a comparison between predicted and measured concentrations in water and sediment
compartments. Our estimations show that predicted water concentrations
(4.5–8.8 ng L
À1 and 2.5–5.9 ng L
À1 for cypermethrin and deltamethrin,
186
F. Tucca and R. Barra
becomes, as shown in Eq. (3):
N ¼ D ij ƒ i À D ji ƒ j
ð3Þ
Reaction processes (D r ) in a compartment were described by Eq. (4):
Dr ¼ k i VC ¼ k i V i Z i ƒ ¼ D r ƒ
ð4Þ
where k i is the reaction rate constant (h
À1 ), which was calculated from pyrethroid
half-life (t 1/2 ) for a specific compartment through the equation k i ¼ 0.693/t 1/2 . V i is
the defined volume for each compartment i (m
3 ) in the area where the salmon farm is
located.
The fugacities were calculated from D values defined for each environmental
compartment [39]. Equations (5) to (7) were used to calculate fugacities in water
(subscript 1), sediment (subscript 2), and fish (subscript 3), respectively.
Water : G a1 C b1 þ ƒ 2 D 21 þ f 3 D 31 þ D e3
ð
Þ¼ƒ 1 D 12 þ D r2 þ D a2
ð
Þ
ð 5Þ
Sediment : E 2 þ ƒ 1 D 12 ¼ ƒ 2 D 21 þ D r2 þ D b2
ð
Þ
ð 6Þ
Fish : E 3 þ f 1 D 13 ¼ f 3 D 31 þ D r3 þ D g3 þ D e3
À
Á
ð7Þ
where E is the emission rate (mol h
À1 ), G a is the advection inflow rate (m
3 h
À1 ), C b is
the advection inflow concentration (mol m
À3 ), and D r , D a , D b , D g , and D e are the
reaction rate, advection outflow rate, sediment burial rate, fish growth rate, and fish
excretion rate, respectively (mol h
À1 ). The model assumed bath treatments with
direct release of pyrethroids into a marine system.
Monte Carlo simulation was used to test the sensitivity and contribution to
variance in the multimedia model, in which the most influential parameters were
identified. The simulation was carried out to assess the uncertainty of predictions
based on the probability distributions for input parameters such as salmon density in
cages (15–17 kg m
À3
), current velocity (6.2 Æ 3.0 cm s
À1 ), organic fraction in
sediment (0.03 Æ 0.54), concentration of suspended particles (4.7 Æ 2.3 mg L
À1 ),
and depth of the study area (40–80 m). The simulations were run for 100,000 trials
using Crystal Ball 11.1.1 software [56].
2.1.2 Mass–Balance Model on Salmon Farms
The use of multimedia fugacity-based models has proven to be a good approach
according to measured environmental concentrations [44]. Figure 2 shows a comparison between predicted and measured concentrations in water and sediment
compartments. Our estimations show that predicted water concentrations
(4.5–8.8 ng L
À1 and 2.5–5.9 ng L
À1 for cypermethrin and deltamethrin,
186
F. Tucca and R. Barra