

compartment (mol m
À3 Pa
À1 ). The diffusive fluxes (N, mol d
À1 ) between compartments are described by Eq. (1):
N ¼ D f i À f j
À
Á
ð1Þ
where D is the transfer coefficient (mol h
À1 Pa
À1 ) and ƒ i and ƒ j are the fugacities of
compartments i and j, respectively. The differences between fugacities determine the
direction of diffusive fluxes of pyrethroids in the marine environment. Meanwhile,
non-diffusive transfer processes were calculated through Eq. (2):
N ¼ GC ¼ GZƒ ¼ Dƒ
ð2Þ
where G is the volumetric flow rate (m
3 h
À1 ) of the transported material. Diffusive
and non-diffusive D values were summed for all transfer processes from
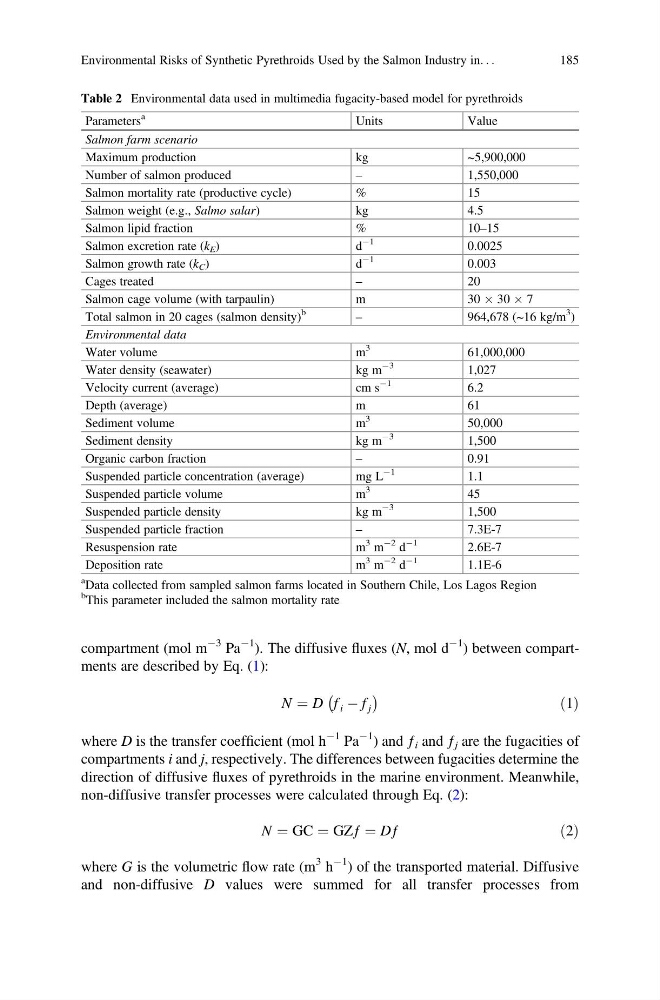
Table 2 Environmental data used in multimedia fugacity-based model for pyrethroids
Parameters
a
Units
Value
Salmon farm scenario
Maximum production
kg
~5,900,000
Number of salmon produced
–
1,550,000
Salmon mortality rate (productive cycle)
%
15
Salmon weight (e.g., Salmo salar)
kg
4.5
Salmon lipid fraction
%
10–15
Salmon excretion rate (k E )
d
À1
0.0025
Salmon growth rate (k C )
d
À1
0.003
Cages treated
–
20
Salmon cage volume (with tarpaulin)
m
30 Â 30 Â 7
Total salmon in 20 cages (salmon density)
b
–
964,678 (~16 kg/m
3
)
Environmental data
Water volume
m
3
61,000,000
Water density (seawater)
kg m
À3
1,027
Velocity current (average)
cm s
À1
6.2
Depth (average)
m
61
Sediment volume
m
3
50,000
Sediment density
kg m
À3
1,500
Organic carbon fraction
–
0.91
Suspended particle concentration (average)
mg L
À1
1.1
Suspended particle volume
m
3
45
Suspended particle density
kg m
À3
1,500
Suspended particle fraction
–
7.3E-7
Resuspension rate
m
3 m
À2 d
À1
2.6E-7
Deposition rate
m
3 m
À2 d
À1
1.1E-6
a Data collected from sampled salmon farms located in Southern Chile, Los Lagos Region
b
This parameter included the salmon mortality rate
Environmental Risks of Synthetic Pyrethroids Used by the Salmon Industry in. . .
185
À3 Pa
À1 ). The diffusive fluxes (N, mol d
À1 ) between compartments are described by Eq. (1):
N ¼ D f i À f j
À
Á
ð1Þ
where D is the transfer coefficient (mol h
À1 Pa
À1 ) and ƒ i and ƒ j are the fugacities of
compartments i and j, respectively. The differences between fugacities determine the
direction of diffusive fluxes of pyrethroids in the marine environment. Meanwhile,
non-diffusive transfer processes were calculated through Eq. (2):
N ¼ GC ¼ GZƒ ¼ Dƒ
ð2Þ
where G is the volumetric flow rate (m
3 h
À1 ) of the transported material. Diffusive
and non-diffusive D values were summed for all transfer processes from
Table 2 Environmental data used in multimedia fugacity-based model for pyrethroids
Parameters
a
Units
Value
Salmon farm scenario
Maximum production
kg
~5,900,000
Number of salmon produced
–
1,550,000
Salmon mortality rate (productive cycle)
%
15
Salmon weight (e.g., Salmo salar)
kg
4.5
Salmon lipid fraction
%
10–15
Salmon excretion rate (k E )
d
À1
0.0025
Salmon growth rate (k C )
d
À1
0.003
Cages treated
–
20
Salmon cage volume (with tarpaulin)
m
30 Â 30 Â 7
Total salmon in 20 cages (salmon density)
b
–
964,678 (~16 kg/m
3
)
Environmental data
Water volume
m
3
61,000,000
Water density (seawater)
kg m
À3
1,027
Velocity current (average)
cm s
À1
6.2
Depth (average)
m
61
Sediment volume
m
3
50,000
Sediment density
kg m
À3
1,500
Organic carbon fraction
–
0.91
Suspended particle concentration (average)
mg L
À1
1.1
Suspended particle volume
m
3
45
Suspended particle density
kg m
À3
1,500
Suspended particle fraction
–
7.3E-7
Resuspension rate
m
3 m
À2 d
À1
2.6E-7
Deposition rate
m
3 m
À2 d
À1
1.1E-6
a Data collected from sampled salmon farms located in Southern Chile, Los Lagos Region
b
This parameter included the salmon mortality rate
Environmental Risks of Synthetic Pyrethroids Used by the Salmon Industry in. . .
185