

50
6.5
Use Minimalist Axes and Grids
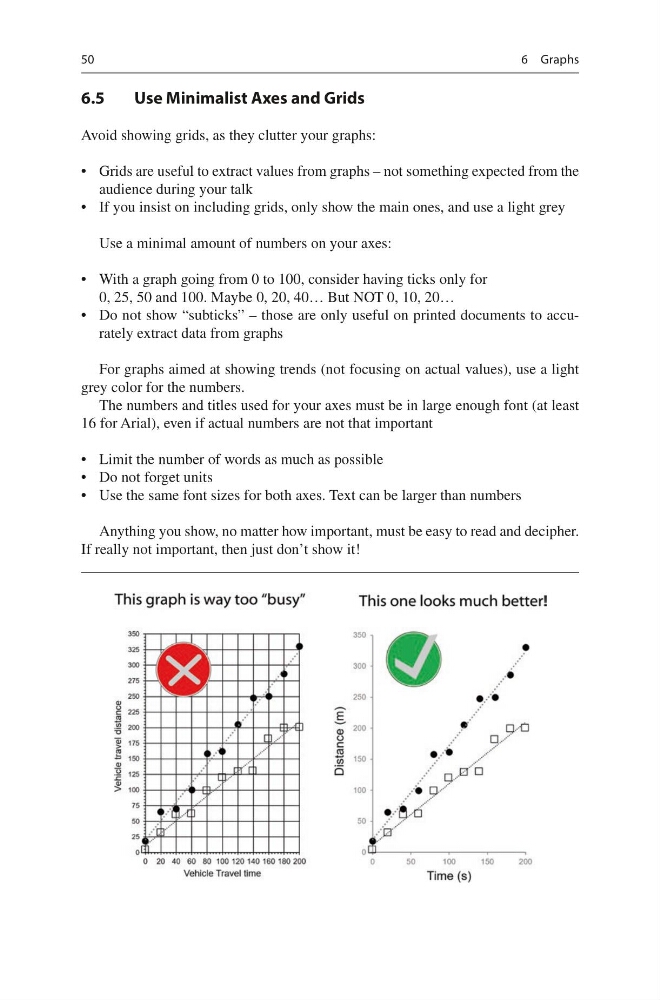
Avoid showing grids, as they clutter your graphs:
• Grids are useful to extract values from graphs – not something expected from the
audience during your talk
• If you insist on including grids, only show the main ones, and use a light grey
Use a minimal amount of numbers on your axes:
• With a graph going from 0 to 100, consider having ticks only for
0, 25, 50 and 100. Maybe 0, 20, 40… But NOT 0, 10, 20…
• Do not show “subticks” – those are only useful on printed documents to accurately extract data from graphs
For graphs aimed at showing trends (not focusing on actual values), use a light
grey color for the numbers.
The numbers and titles used for your axes must be in large enough font (at least
16 for Arial), even if actual numbers are not that important
• Limit the number of words as much as possible
• Do not forget units
• Use the same font sizes for both axes. Text can be larger than numbers
Anything you show, no matter how important, must be easy to read and decipher.
If really not important, then just don’t show it!
6 Graphs
6.5
Use Minimalist Axes and Grids
Avoid showing grids, as they clutter your graphs:
• Grids are useful to extract values from graphs – not something expected from the
audience during your talk
• If you insist on including grids, only show the main ones, and use a light grey
Use a minimal amount of numbers on your axes:
• With a graph going from 0 to 100, consider having ticks only for
0, 25, 50 and 100. Maybe 0, 20, 40… But NOT 0, 10, 20…
• Do not show “subticks” – those are only useful on printed documents to accurately extract data from graphs
For graphs aimed at showing trends (not focusing on actual values), use a light
grey color for the numbers.
The numbers and titles used for your axes must be in large enough font (at least
16 for Arial), even if actual numbers are not that important
• Limit the number of words as much as possible
• Do not forget units
• Use the same font sizes for both axes. Text can be larger than numbers
Anything you show, no matter how important, must be easy to read and decipher.
If really not important, then just don’t show it!
6 Graphs