

9 Atmospheric Contribution to Eutrophication of the Baltic Sea
55
maximum values, corresponding to the best and worst meteorological conditions,
have been also calculated, indicating meteorological uncertainty.
Compared to 1995, annual deposition of oxidised nitrogen in 2015 is 33% lower.
The normalized deposition of oxidised nitrogen is even more declining in the same
period −35%. So, there is clear decline in the deposition of oxidised nitrogen to
the Baltic Sea basin in the period 1995–2014. Uncertainty indicated by a relative
distance between minimum and maximum deposition for each year is 29%.
In case of reduced nitrogen deposition to the Baltic Sea basin, annual deposition
in 2015 is 5% higher in 2015 than at the beginning of the period in 1995. The normalised deposition of reduced nitrogen is declining (12%) in 2015 compared to 1995
deposition. However, there is a slight increase in the reduced nitrogen deposition at
the end of the period. Uncertainty indicated by a relative distance between minimum
and maximum deposition for each year is slightly higher in case of reduced nitrogen
compared to oxidized nitrogen −35%.
9.3 Main Sources of Nitrogen Deposition to the Baltic Sea
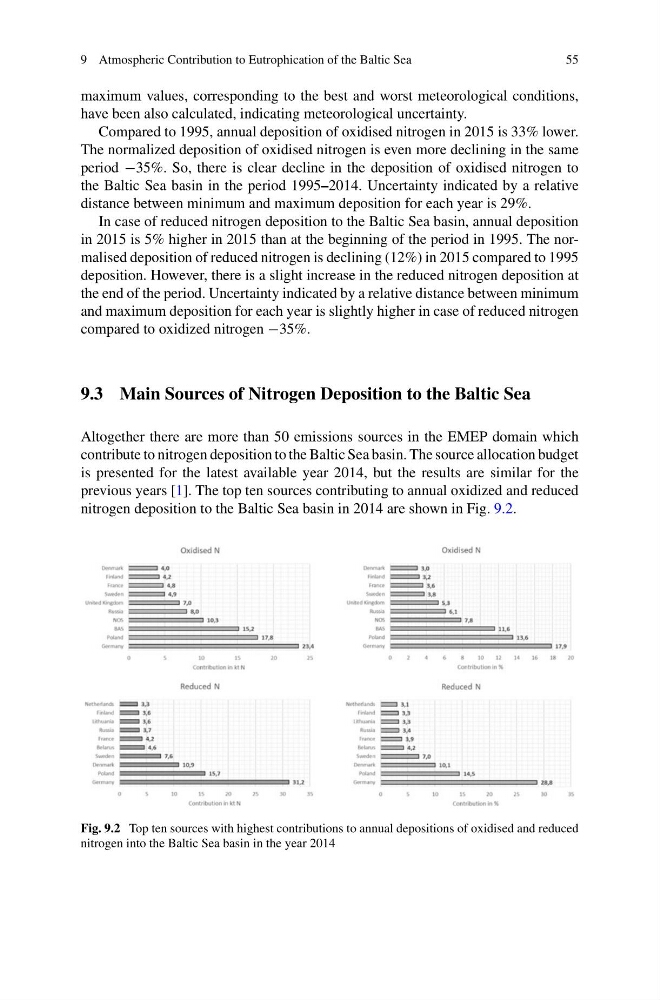
Altogether there are more than 50 emissions sources in the EMEP domain which
contribute to nitrogen deposition to the Baltic Sea basin. The source allocation budget
is presented for the latest available year 2014, but the results are similar for the
previous years [1]. The top ten sources contributing to annual oxidized and reduced
nitrogen deposition to the Baltic Sea basin in 2014 are shown in Fig. 9.2.
Fig. 9.2 Top ten sources with highest contributions to annual depositions of oxidised and reduced
nitrogen into the Baltic Sea basin in the year 2014
55
maximum values, corresponding to the best and worst meteorological conditions,
have been also calculated, indicating meteorological uncertainty.
Compared to 1995, annual deposition of oxidised nitrogen in 2015 is 33% lower.
The normalized deposition of oxidised nitrogen is even more declining in the same
period −35%. So, there is clear decline in the deposition of oxidised nitrogen to
the Baltic Sea basin in the period 1995–2014. Uncertainty indicated by a relative
distance between minimum and maximum deposition for each year is 29%.
In case of reduced nitrogen deposition to the Baltic Sea basin, annual deposition
in 2015 is 5% higher in 2015 than at the beginning of the period in 1995. The normalised deposition of reduced nitrogen is declining (12%) in 2015 compared to 1995
deposition. However, there is a slight increase in the reduced nitrogen deposition at
the end of the period. Uncertainty indicated by a relative distance between minimum
and maximum deposition for each year is slightly higher in case of reduced nitrogen
compared to oxidized nitrogen −35%.
9.3 Main Sources of Nitrogen Deposition to the Baltic Sea
Altogether there are more than 50 emissions sources in the EMEP domain which
contribute to nitrogen deposition to the Baltic Sea basin. The source allocation budget
is presented for the latest available year 2014, but the results are similar for the
previous years [1]. The top ten sources contributing to annual oxidized and reduced
nitrogen deposition to the Baltic Sea basin in 2014 are shown in Fig. 9.2.
Fig. 9.2 Top ten sources with highest contributions to annual depositions of oxidised and reduced
nitrogen into the Baltic Sea basin in the year 2014