

54
J. Bartnicki
Sea based on measurements and model calculations. In the frame of a long-term
cooperation between Helsinki Commission and EMEP, nitrogen depositions to the
Baltic Sea Basin and its sub-basins are calculated every year in the Meteorological
Synthesizing Centre-West (MSC-W) of EMEP in Oslo [2]. Time series of annual
nitrogen depositions to the Baltic Sea have been calculated for the period 1995–2015.
They show significant inter annual fluctuations due to changes in meteorological
conditions from one year to another. The so called “normalized” depositions have
been also calculated to reduce the influence of meteorological variability. Additional
important task for MSC-W is the identification of main emission sources contributing
to nitrogen deposition into the entire basin and sub-basins of the Baltic Sea. Here
we present and discuss the main emission sources contributing to annual nitrogen
deposition into the Baltic Sea basin in the year 2014.
The EMEP/MSC-W model, a multi-pollutant 3D Eulerian Chemical Transport
Model, has been used for all nitrogen computations presented here. It has been
documented in detail in [4] and in the annual chapters on model updates in subsequent
EMEP status reports with the last one in 2017 [5].
The model is regularly evaluated against measurements from the EMEP network
under the LRTAP convention (e.g. [3]). The performance of the EMEP/MSC-W
model can be considered as state-of-the-art over a large range of both gaseous species
and particulate matter.
9.2 Atmospheric Nitrogen Deposition to the Baltic Sea
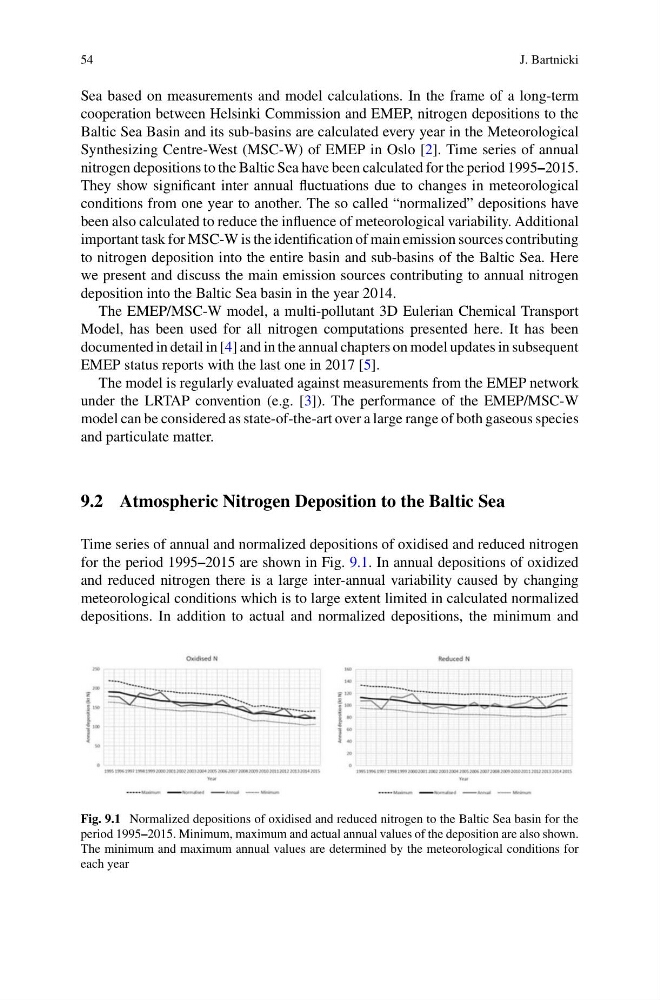
Time series of annual and normalized depositions of oxidised and reduced nitrogen
for the period 1995–2015 are shown in Fig. 9.1. In annual depositions of oxidized
and reduced nitrogen there is a large inter-annual variability caused by changing
meteorological conditions which is to large extent limited in calculated normalized
depositions. In addition to actual and normalized depositions, the minimum and
Fig. 9.1 Normalized depositions of oxidised and reduced nitrogen to the Baltic Sea basin for the
period 1995–2015. Minimum, maximum and actual annual values of the deposition are also shown.
The minimum and maximum annual values are determined by the meteorological conditions for
each year
J. Bartnicki
Sea based on measurements and model calculations. In the frame of a long-term
cooperation between Helsinki Commission and EMEP, nitrogen depositions to the
Baltic Sea Basin and its sub-basins are calculated every year in the Meteorological
Synthesizing Centre-West (MSC-W) of EMEP in Oslo [2]. Time series of annual
nitrogen depositions to the Baltic Sea have been calculated for the period 1995–2015.
They show significant inter annual fluctuations due to changes in meteorological
conditions from one year to another. The so called “normalized” depositions have
been also calculated to reduce the influence of meteorological variability. Additional
important task for MSC-W is the identification of main emission sources contributing
to nitrogen deposition into the entire basin and sub-basins of the Baltic Sea. Here
we present and discuss the main emission sources contributing to annual nitrogen
deposition into the Baltic Sea basin in the year 2014.
The EMEP/MSC-W model, a multi-pollutant 3D Eulerian Chemical Transport
Model, has been used for all nitrogen computations presented here. It has been
documented in detail in [4] and in the annual chapters on model updates in subsequent
EMEP status reports with the last one in 2017 [5].
The model is regularly evaluated against measurements from the EMEP network
under the LRTAP convention (e.g. [3]). The performance of the EMEP/MSC-W
model can be considered as state-of-the-art over a large range of both gaseous species
and particulate matter.
9.2 Atmospheric Nitrogen Deposition to the Baltic Sea
Time series of annual and normalized depositions of oxidised and reduced nitrogen
for the period 1995–2015 are shown in Fig. 9.1. In annual depositions of oxidized
and reduced nitrogen there is a large inter-annual variability caused by changing
meteorological conditions which is to large extent limited in calculated normalized
depositions. In addition to actual and normalized depositions, the minimum and
Fig. 9.1 Normalized depositions of oxidised and reduced nitrogen to the Baltic Sea basin for the
period 1995–2015. Minimum, maximum and actual annual values of the deposition are also shown.
The minimum and maximum annual values are determined by the meteorological conditions for
each year