

38
D. C. Wong et al.
6.2.3 Data Exchange and I/O
A coupler was constructed to facilitate data exchange between the MPAS-A and AQ
models. This coupler also provides other functions: converts perturbation pressure to
pressure and potential temperature to temperature that the AQ model needs, computes
other AQ model specific data, such as level height, rearranges data dimension order
(MPAS-A is k i and AQ is i k), and injects O 3 analysis data from the Global Forecast
System (GFS) into the highest model layers according to a predefined lowest layer
threshold and nudging algorithm.
In addition, a new input/output (I/O) system is implemented in this coupled model
to allow the AQ model to output any information independent of the MPAS-A I/O
system. This extra layer of flexibility reduces user burden to modify the model registry
file prior to code compilation and allows the user to control which files to output via
the run script.
6.3 Preliminary Model Results
A month of simulation from July 1, 2013 to July 31, 2013 was completed based on the
emissions constructed using the methods described above. For simplicity, the same
emission file was replicated for each day of the month. The global non-uniform
90–25 km mesh (finer resolution over North America) was used. The simulation
was initialized with clean initial conditions and was run using 128 processor cores,
requiring an average of 144 min to simulate one day.
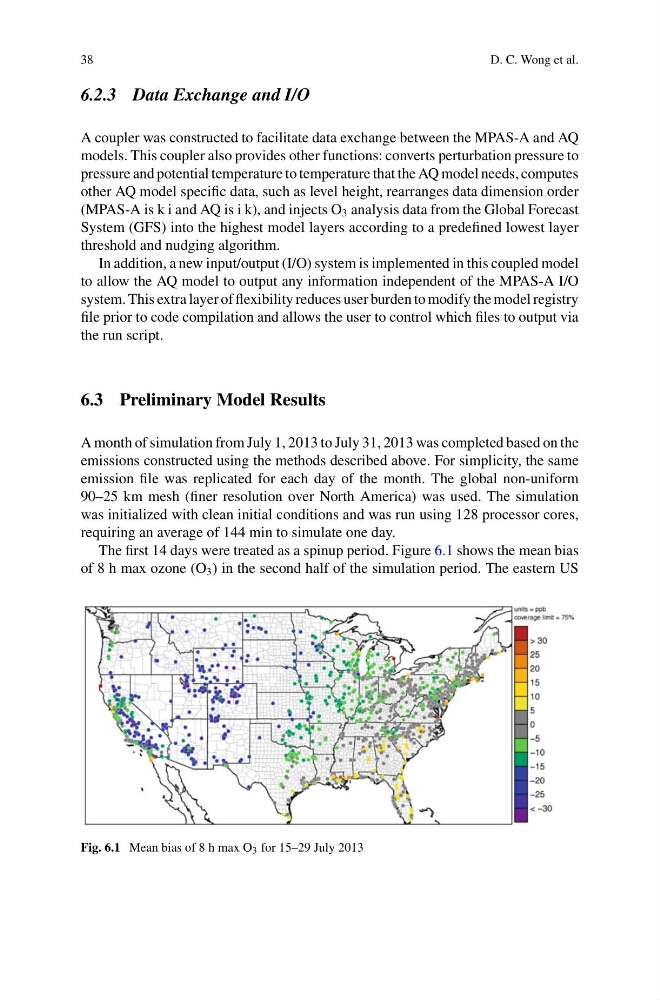
The first 14 days were treated as a spinup period. Figure 6.1 shows the mean bias
of 8 h max ozone (O 3 ) in the second half of the simulation period. The eastern US
Fig. 6.1 Mean bias of 8 h max O 3 for 15–29 July 2013
D. C. Wong et al.
6.2.3 Data Exchange and I/O
A coupler was constructed to facilitate data exchange between the MPAS-A and AQ
models. This coupler also provides other functions: converts perturbation pressure to
pressure and potential temperature to temperature that the AQ model needs, computes
other AQ model specific data, such as level height, rearranges data dimension order
(MPAS-A is k i and AQ is i k), and injects O 3 analysis data from the Global Forecast
System (GFS) into the highest model layers according to a predefined lowest layer
threshold and nudging algorithm.
In addition, a new input/output (I/O) system is implemented in this coupled model
to allow the AQ model to output any information independent of the MPAS-A I/O
system. This extra layer of flexibility reduces user burden to modify the model registry
file prior to code compilation and allows the user to control which files to output via
the run script.
6.3 Preliminary Model Results
A month of simulation from July 1, 2013 to July 31, 2013 was completed based on the
emissions constructed using the methods described above. For simplicity, the same
emission file was replicated for each day of the month. The global non-uniform
90–25 km mesh (finer resolution over North America) was used. The simulation
was initialized with clean initial conditions and was run using 128 processor cores,
requiring an average of 144 min to simulate one day.
The first 14 days were treated as a spinup period. Figure 6.1 shows the mean bias
of 8 h max ozone (O 3 ) in the second half of the simulation period. The eastern US
Fig. 6.1 Mean bias of 8 h max O 3 for 15–29 July 2013