

32
J. Jiang et al.
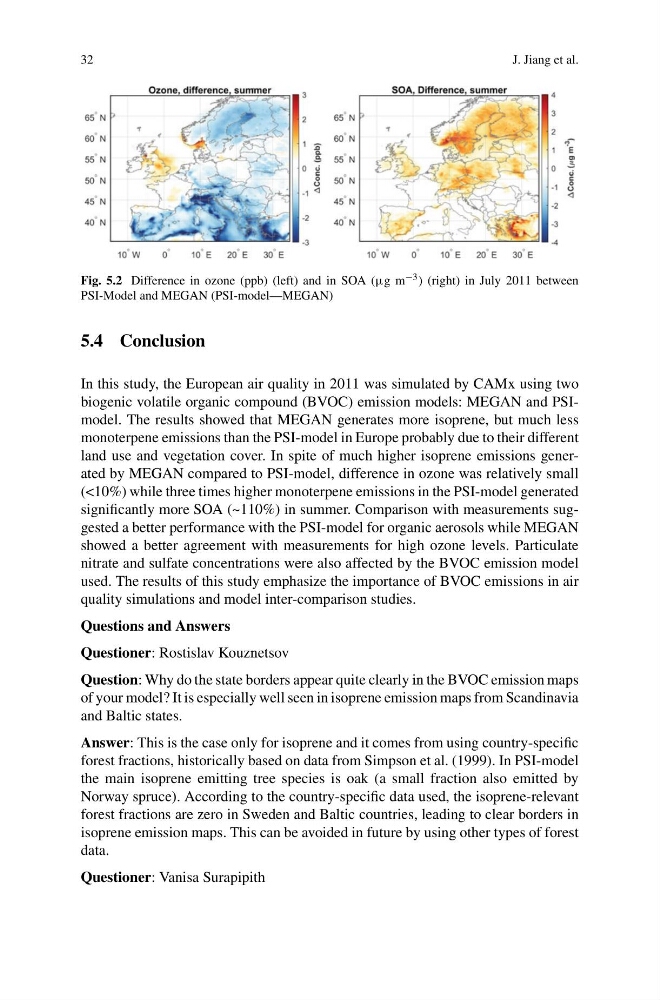
Fig. 5.2 Difference in ozone (ppb) (left) and in SOA (µg m −3 ) (right) in July 2011 between
PSI-Model and MEGAN (PSI-model—MEGAN)
5.4 Conclusion
In this study, the European air quality in 2011 was simulated by CAMx using two
biogenic volatile organic compound (BVOC) emission models: MEGAN and PSImodel. The results showed that MEGAN generates more isoprene, but much less
monoterpene emissions than the PSI-model in Europe probably due to their different
land use and vegetation cover. In spite of much higher isoprene emissions generated by MEGAN compared to PSI-model, difference in ozone was relatively small
(<10%) while three times higher monoterpene emissions in the PSI-model generated
significantly more SOA (~110%) in summer. Comparison with measurements suggested a better performance with the PSI-model for organic aerosols while MEGAN
showed a better agreement with measurements for high ozone levels. Particulate
nitrate and sulfate concentrations were also affected by the BVOC emission model
used. The results of this study emphasize the importance of BVOC emissions in air
quality simulations and model inter-comparison studies.
Questions and Answers
Questioner: Rostislav Kouznetsov
Question: Why do the state borders appear quite clearly in the BVOC emission maps
of your model? It is especially well seen in isoprene emission maps from Scandinavia
and Baltic states.
Answer: This is the case only for isoprene and it comes from using country-specific
forest fractions, historically based on data from Simpson et al. (1999). In PSI-model
the main isoprene emitting tree species is oak (a small fraction also emitted by
Norway spruce). According to the country-specific data used, the isoprene-relevant
forest fractions are zero in Sweden and Baltic countries, leading to clear borders in
isoprene emission maps. This can be avoided in future by using other types of forest
data.
Questioner: Vanisa Surapipith
J. Jiang et al.
Fig. 5.2 Difference in ozone (ppb) (left) and in SOA (µg m −3 ) (right) in July 2011 between
PSI-Model and MEGAN (PSI-model—MEGAN)
5.4 Conclusion
In this study, the European air quality in 2011 was simulated by CAMx using two
biogenic volatile organic compound (BVOC) emission models: MEGAN and PSImodel. The results showed that MEGAN generates more isoprene, but much less
monoterpene emissions than the PSI-model in Europe probably due to their different
land use and vegetation cover. In spite of much higher isoprene emissions generated by MEGAN compared to PSI-model, difference in ozone was relatively small
(<10%) while three times higher monoterpene emissions in the PSI-model generated
significantly more SOA (~110%) in summer. Comparison with measurements suggested a better performance with the PSI-model for organic aerosols while MEGAN
showed a better agreement with measurements for high ozone levels. Particulate
nitrate and sulfate concentrations were also affected by the BVOC emission model
used. The results of this study emphasize the importance of BVOC emissions in air
quality simulations and model inter-comparison studies.
Questions and Answers
Questioner: Rostislav Kouznetsov
Question: Why do the state borders appear quite clearly in the BVOC emission maps
of your model? It is especially well seen in isoprene emission maps from Scandinavia
and Baltic states.
Answer: This is the case only for isoprene and it comes from using country-specific
forest fractions, historically based on data from Simpson et al. (1999). In PSI-model
the main isoprene emitting tree species is oak (a small fraction also emitted by
Norway spruce). According to the country-specific data used, the isoprene-relevant
forest fractions are zero in Sweden and Baltic countries, leading to clear borders in
isoprene emission maps. This can be avoided in future by using other types of forest
data.
Questioner: Vanisa Surapipith