

5 Effects of Using Two Different Biogenic Emission Models…
31
5.3 Results and Discussion
We focussed on summer since the emissions in winter were much lower, especially
for isoprene. The comparison of biogenic emissions from the two BVOC models
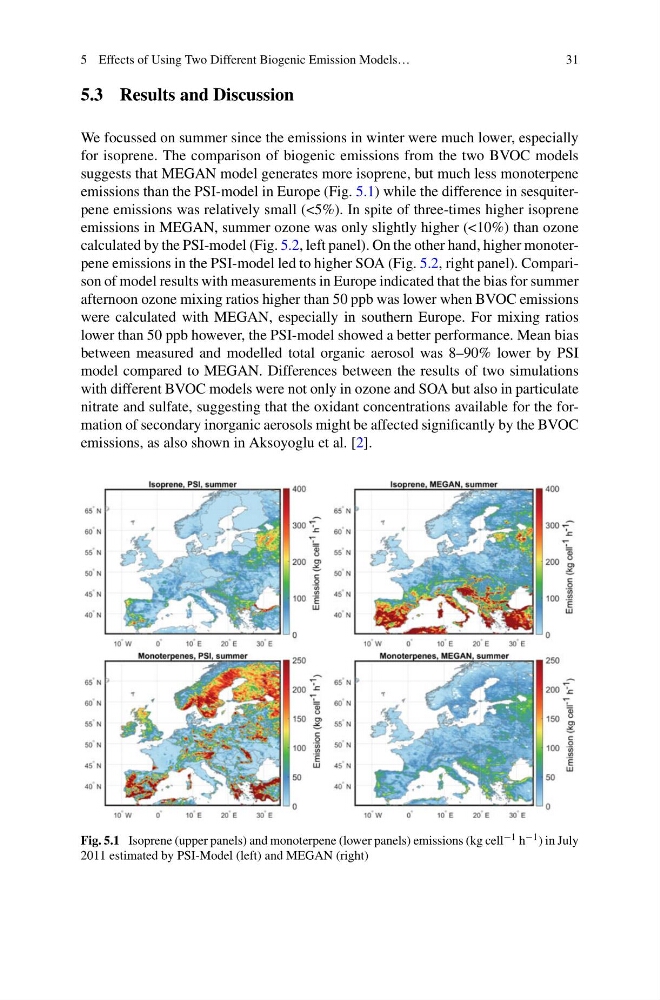
suggests that MEGAN model generates more isoprene, but much less monoterpene
emissions than the PSI-model in Europe (Fig. 5.1) while the difference in sesquiterpene emissions was relatively small (<5%). In spite of three-times higher isoprene
emissions in MEGAN, summer ozone was only slightly higher (<10%) than ozone
calculated by the PSI-model (Fig. 5.2, left panel). On the other hand, higher monoterpene emissions in the PSI-model led to higher SOA (Fig. 5.2, right panel). Comparison of model results with measurements in Europe indicated that the bias for summer
afternoon ozone mixing ratios higher than 50 ppb was lower when BVOC emissions
were calculated with MEGAN, especially in southern Europe. For mixing ratios
lower than 50 ppb however, the PSI-model showed a better performance. Mean bias
between measured and modelled total organic aerosol was 8–90% lower by PSI
model compared to MEGAN. Differences between the results of two simulations
with different BVOC models were not only in ozone and SOA but also in particulate
nitrate and sulfate, suggesting that the oxidant concentrations available for the formation of secondary inorganic aerosols might be affected significantly by the BVOC
emissions, as also shown in Aksoyoglu et al. [2].
Fig. 5.1 Isoprene (upper panels) and monoterpene (lower panels) emissions (kg cell −1 h −1 ) in July
2011 estimated by PSI-Model (left) and MEGAN (right)
31
5.3 Results and Discussion
We focussed on summer since the emissions in winter were much lower, especially
for isoprene. The comparison of biogenic emissions from the two BVOC models
suggests that MEGAN model generates more isoprene, but much less monoterpene
emissions than the PSI-model in Europe (Fig. 5.1) while the difference in sesquiterpene emissions was relatively small (<5%). In spite of three-times higher isoprene
emissions in MEGAN, summer ozone was only slightly higher (<10%) than ozone
calculated by the PSI-model (Fig. 5.2, left panel). On the other hand, higher monoterpene emissions in the PSI-model led to higher SOA (Fig. 5.2, right panel). Comparison of model results with measurements in Europe indicated that the bias for summer
afternoon ozone mixing ratios higher than 50 ppb was lower when BVOC emissions
were calculated with MEGAN, especially in southern Europe. For mixing ratios
lower than 50 ppb however, the PSI-model showed a better performance. Mean bias
between measured and modelled total organic aerosol was 8–90% lower by PSI
model compared to MEGAN. Differences between the results of two simulations
with different BVOC models were not only in ozone and SOA but also in particulate
nitrate and sulfate, suggesting that the oxidant concentrations available for the formation of secondary inorganic aerosols might be affected significantly by the BVOC
emissions, as also shown in Aksoyoglu et al. [2].
Fig. 5.1 Isoprene (upper panels) and monoterpene (lower panels) emissions (kg cell −1 h −1 ) in July
2011 estimated by PSI-Model (left) and MEGAN (right)