

6
R. Timmermans et al.
during the episode from ~ 20 January to halfway February. The implemented model
improvements lead to a considerable improvement of the model performance. Nevertheless a strong underestimation remains present. There are several possible reasons
for this. For example, the amount of condensables in the improved emission database
is based on standard temperatures, during very cold conditions, the amount can be
much larger. Another reason could be the meteorological data driving the model.
The meteorological conditions during stable cold conditions are often difficult to
represent, the (vertical) mixing may be too high.
1.3.2 Source Apportionment
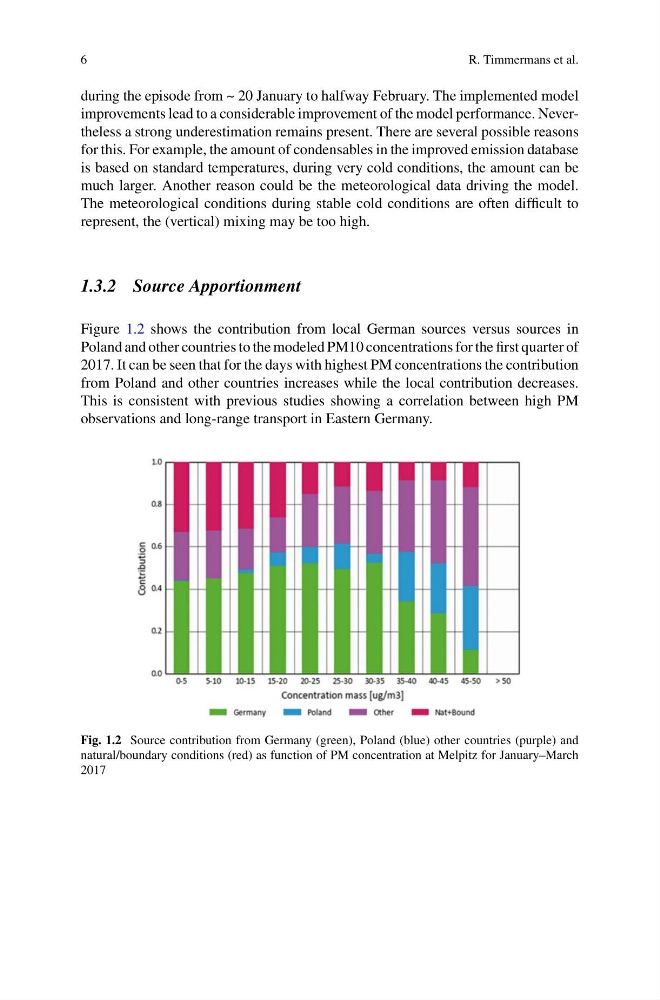
Figure 1.2 shows the contribution from local German sources versus sources in
Poland and other countries to the modeled PM10 concentrations for the first quarter of
2017. It can be seen that for the days with highest PM concentrations the contribution
from Poland and other countries increases while the local contribution decreases.
This is consistent with previous studies showing a correlation between high PM
observations and long-range transport in Eastern Germany.
Fig. 1.2 Source contribution from Germany (green), Poland (blue) other countries (purple) and
natural/boundary conditions (red) as function of PM concentration at Melpitz for January–March
2017
R. Timmermans et al.
during the episode from ~ 20 January to halfway February. The implemented model
improvements lead to a considerable improvement of the model performance. Nevertheless a strong underestimation remains present. There are several possible reasons
for this. For example, the amount of condensables in the improved emission database
is based on standard temperatures, during very cold conditions, the amount can be
much larger. Another reason could be the meteorological data driving the model.
The meteorological conditions during stable cold conditions are often difficult to
represent, the (vertical) mixing may be too high.
1.3.2 Source Apportionment
Figure 1.2 shows the contribution from local German sources versus sources in
Poland and other countries to the modeled PM10 concentrations for the first quarter of
2017. It can be seen that for the days with highest PM concentrations the contribution
from Poland and other countries increases while the local contribution decreases.
This is consistent with previous studies showing a correlation between high PM
observations and long-range transport in Eastern Germany.
Fig. 1.2 Source contribution from Germany (green), Poland (blue) other countries (purple) and
natural/boundary conditions (red) as function of PM concentration at Melpitz for January–March
2017