

436
F. Garcia-Menendez et al.
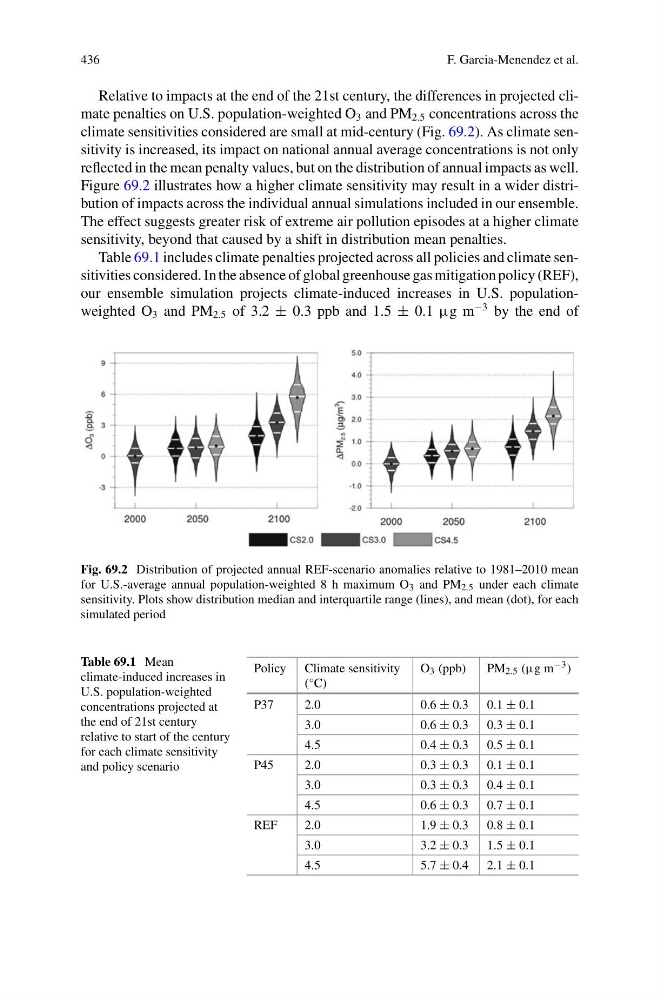
Relative to impacts at the end of the 21st century, the differences in projected climate penalties on U.S. population-weighted O 3 and PM 2.5 concentrations across the
climate sensitivities considered are small at mid-century (Fig. 69.2). As climate sensitivity is increased, its impact on national annual average concentrations is not only
reflected in the mean penalty values, but on the distribution of annual impacts as well.
Figure 69.2 illustrates how a higher climate sensitivity may result in a wider distribution of impacts across the individual annual simulations included in our ensemble.
The effect suggests greater risk of extreme air pollution episodes at a higher climate
sensitivity, beyond that caused by a shift in distribution mean penalties.
Table 69.1 includes climate penalties projected across all policies and climate sensitivities considered. In the absence of global greenhouse gas mitigation policy (REF),
our ensemble simulation projects climate-induced increases in U.S. populationweighted O 3 and PM 2.5 of 3.2 ± 0.3 ppb and 1.5 ± 0.1 µg m
−3 by the end of
Fig. 69.2 Distribution of projected annual REF-scenario anomalies relative to 1981–2010 mean
for U.S.-average annual population-weighted 8 h maximum O 3 and PM 2.5 under each climate
sensitivity. Plots show distribution median and interquartile range (lines), and mean (dot), for each
simulated period
Table 69.1 Mean
climate-induced increases in
U.S. population-weighted
concentrations projected at
the end of 21st century
relative to start of the century
for each climate sensitivity
and policy scenario
Policy Climate sensitivity
(°C)
O 3 (ppb)
PM 2.5 (µg m −3 )
P37
2.0
0.6 ± 0.3 0.1 ± 0.1
3.0
0.6 ± 0.3 0.3 ± 0.1
4.5
0.4 ± 0.3 0.5 ± 0.1
P45
2.0
0.3 ± 0.3 0.1 ± 0.1
3.0
0.3 ± 0.3 0.4 ± 0.1
4.5
0.6 ± 0.3 0.7 ± 0.1
REF
2.0
1.9 ± 0.3 0.8 ± 0.1
3.0
3.2 ± 0.3 1.5 ± 0.1
4.5
5.7 ± 0.4 2.1 ± 0.1
F. Garcia-Menendez et al.
Relative to impacts at the end of the 21st century, the differences in projected climate penalties on U.S. population-weighted O 3 and PM 2.5 concentrations across the
climate sensitivities considered are small at mid-century (Fig. 69.2). As climate sensitivity is increased, its impact on national annual average concentrations is not only
reflected in the mean penalty values, but on the distribution of annual impacts as well.
Figure 69.2 illustrates how a higher climate sensitivity may result in a wider distribution of impacts across the individual annual simulations included in our ensemble.
The effect suggests greater risk of extreme air pollution episodes at a higher climate
sensitivity, beyond that caused by a shift in distribution mean penalties.
Table 69.1 includes climate penalties projected across all policies and climate sensitivities considered. In the absence of global greenhouse gas mitigation policy (REF),
our ensemble simulation projects climate-induced increases in U.S. populationweighted O 3 and PM 2.5 of 3.2 ± 0.3 ppb and 1.5 ± 0.1 µg m
−3 by the end of
Fig. 69.2 Distribution of projected annual REF-scenario anomalies relative to 1981–2010 mean
for U.S.-average annual population-weighted 8 h maximum O 3 and PM 2.5 under each climate
sensitivity. Plots show distribution median and interquartile range (lines), and mean (dot), for each
simulated period
Table 69.1 Mean
climate-induced increases in
U.S. population-weighted
concentrations projected at
the end of 21st century
relative to start of the century
for each climate sensitivity
and policy scenario
Policy Climate sensitivity
(°C)
O 3 (ppb)
PM 2.5 (µg m −3 )
P37
2.0
0.6 ± 0.3 0.1 ± 0.1
3.0
0.6 ± 0.3 0.3 ± 0.1
4.5
0.4 ± 0.3 0.5 ± 0.1
P45
2.0
0.3 ± 0.3 0.1 ± 0.1
3.0
0.3 ± 0.3 0.4 ± 0.1
4.5
0.6 ± 0.3 0.7 ± 0.1
REF
2.0
1.9 ± 0.3 0.8 ± 0.1
3.0
3.2 ± 0.3 1.5 ± 0.1
4.5
5.7 ± 0.4 2.1 ± 0.1